Optimize your code using profilers
Overview. yappi and CProfile vs VMprof
PyCharm allows running the current run/debug configuration while attaching a Python profiler to it.
If you have a yappi profiler installed on your interpreter, PyCharm starts the profiling session with it by default, otherwise it uses the standard cProfile profiler.
Besides these two tracing profilers, PyCharm supports also sampling (statistical) profiler vmprof, which should be installed on the selected Python interpreter.
Note the following:
A profiler runs on both local and remote interpreters.
A profiler runs in the following order: vmprof, yappi, cProfile.
Starting the profiling session
To start the profiling session, do one of the following:
Click
 on the main toolbar.
Choose from the main menu.
The profiler starts in the dedicated tab of the Run tool window.
Working with the profiling results
On the toolbar of the profiler tab, click ![]() . This action results in the following:
. This action results in the following:
The snapshot is saved to the default location under .PyCharmXX/system/snapshots directory under the user's home. For CProfiler, it is saved as <project name>.pstat file:
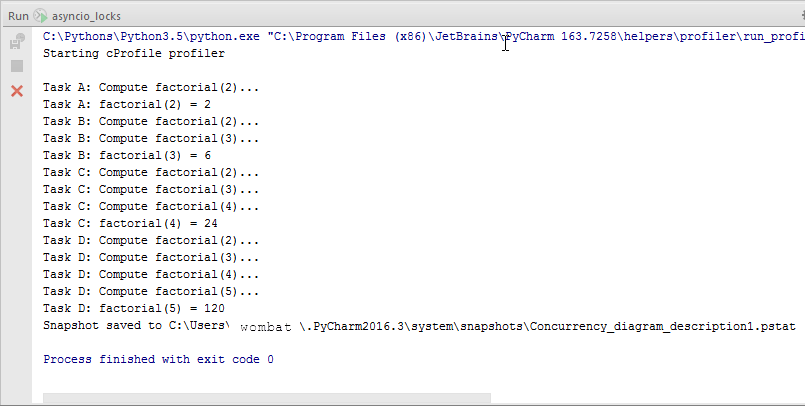
-
The profiling results open in the <project name>.pstat tab in the editor, which consists of two tabs: Statistics and Call Graph:
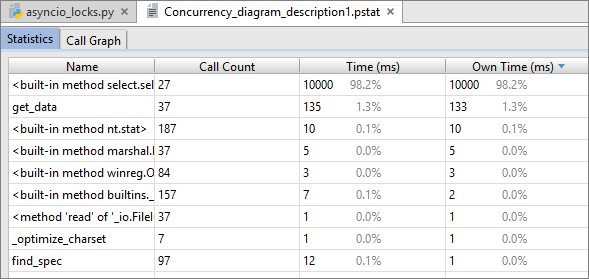
For vmprof, it is saved as <project name>.prof file.
Jumping to the source code
To navigate to the source code of a certain function, right-click the corresponding entry on the Statistics tab, and choose from the context menu:
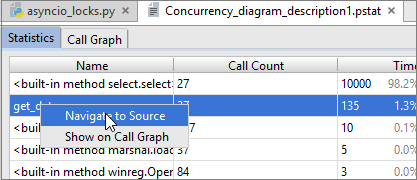
The source code of the function opens in the editor.
Viewing call graph
To navigate to the call graph of a certain function, right-click the corresponding entry on the Statistics tab, and choose from the context menu.
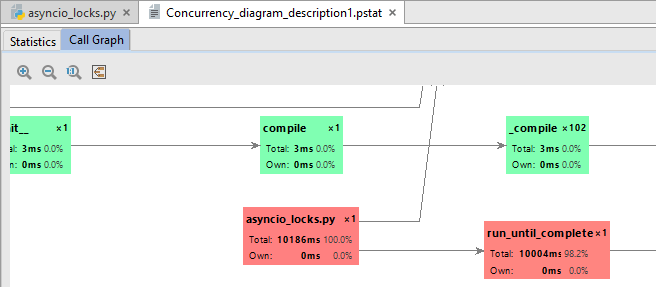
The Call Graph tab opens with the function un question highlighted:
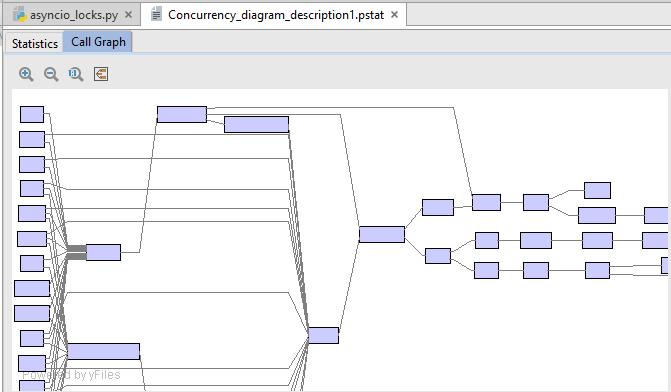
To increase the graph scale, click ![]() ; to show actual size of the graph, click
; to show actual size of the graph, click ![]() .
.
Use the toolbar button ![]() to fit contents into the current diagram size.
to fit contents into the current diagram size.
To decrease the graph scale, use ![]() .
.
Note the color codes on the Call Graph. The functions marked red consume more time; the fastest functions are green.
Reviewing the existing snapshots
To open an existing snapshot, follow these steps:
From the main menu, choose .
-
In the Select PStat file dialog, choose the desired file with the extension pstat.
The profiling results open in the <project name>.pstat tab in the editor.