Viewing as Array or DataFrame
Limitations
This command is available for:
The variables that represent NumPy arrays.
The variables that represent pandas dataframes.
Hence, NumPy or pandas must be downloaded and installed in your Python interpreter.
Viewing as array or DataFrame
From the Variables tab of the Debug tool window
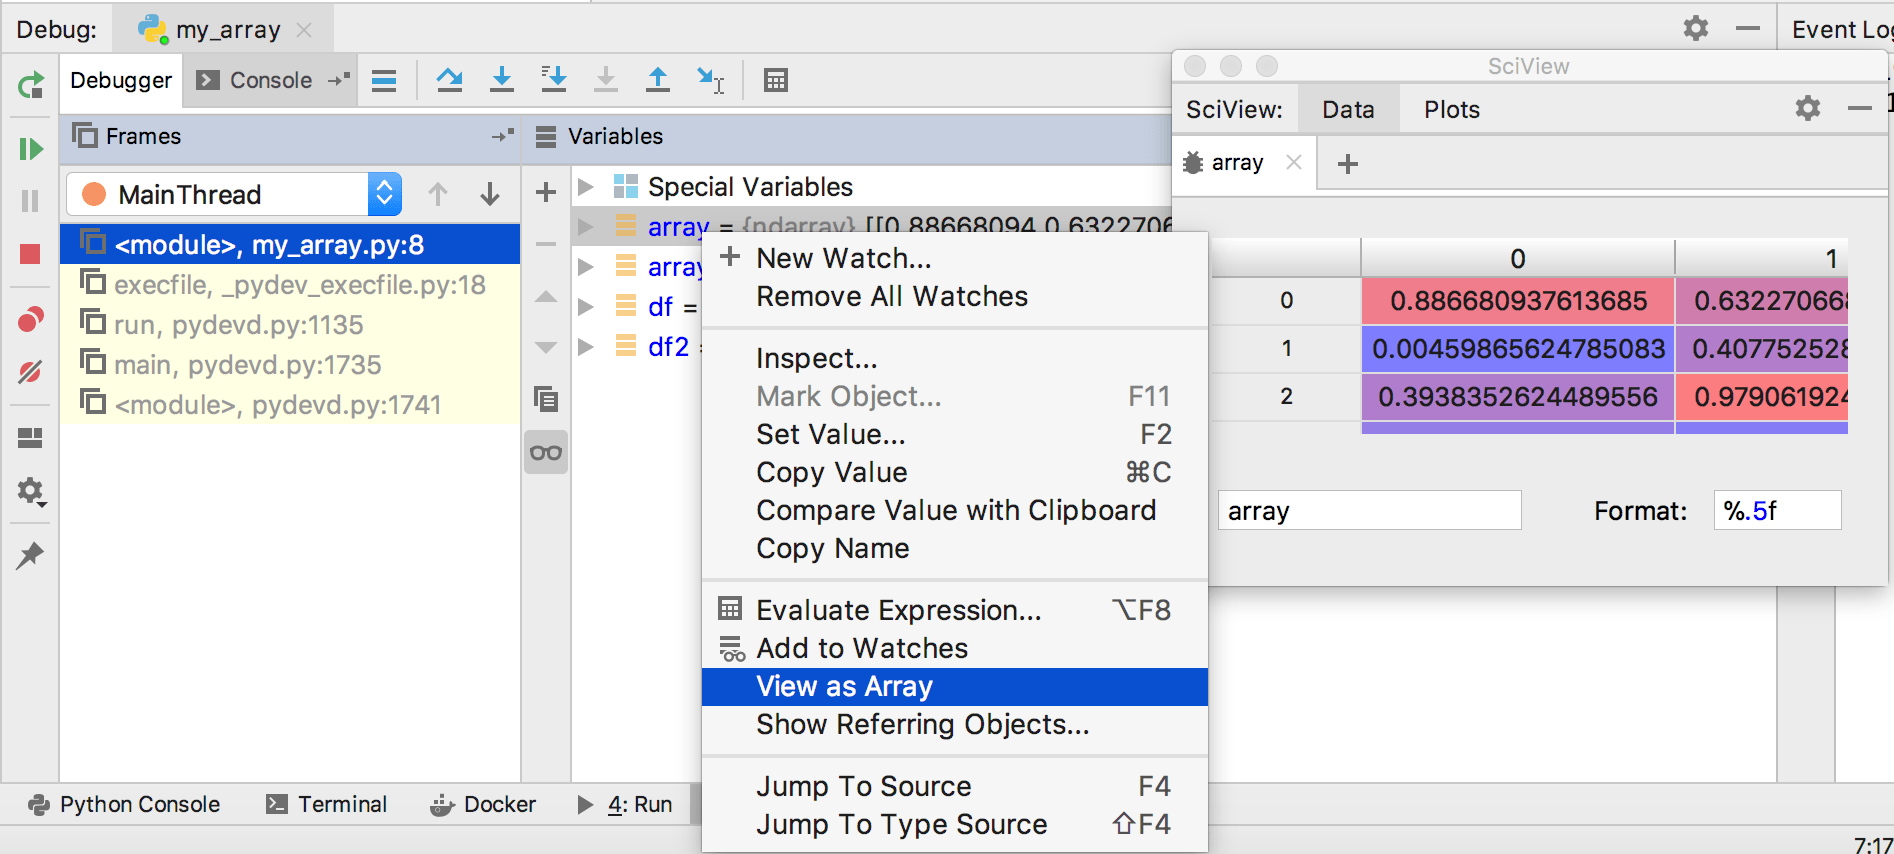
In the Variables tab of the Debug tool window, select an array or a DataFrame.
-
Click a link View as Array/View as DataFrame to the right.

Alternatively, you can choose View as Array or View as DataFrame from the context menu.
The Data View tool window appears.
One can also use the command View as Array from the Python console.
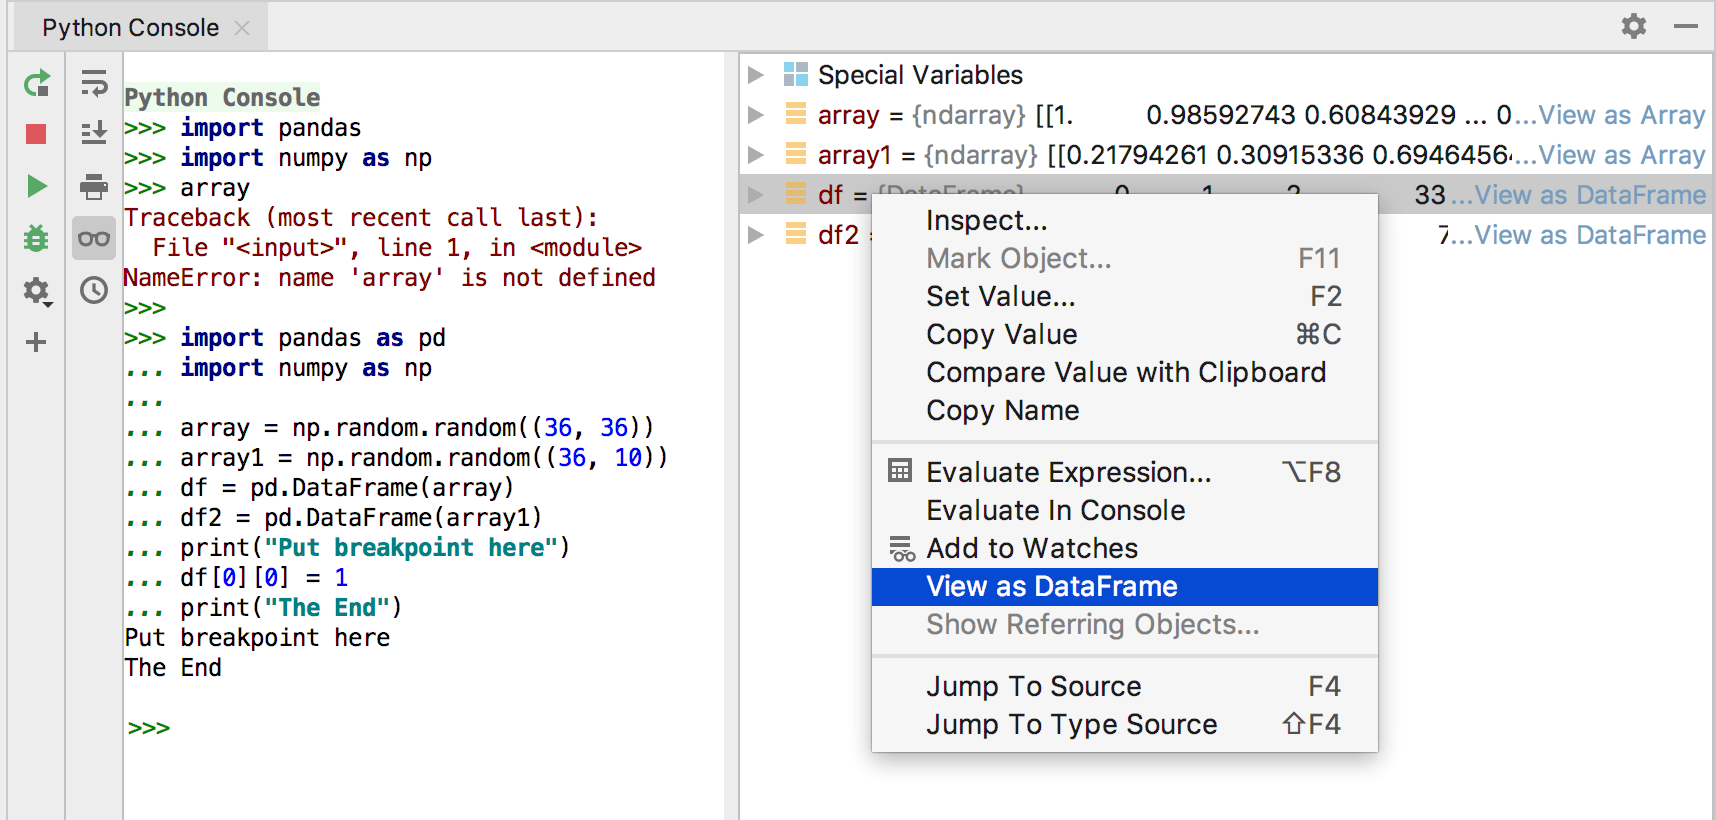
From the Python console
Execute a Python code, for example:
import pandas as pd import numpy as np array = np.random.random((36, 36)) array1 = np.random.random((36, 10)) df = pd.DataFrame(array) df2 = pd.DataFrame(array1) print("Put breakpoint here") df[0][0] = 1 print("The End")In the toolbar of the console, click
 . The variables declared in the console, appear to the right.
-
Do one of the following:
Click the link View as Array/View as DataFrame:

F rom the context menu of a variable, choose View as Array/ View as DataFrame:

Actions available via the Data View tool window
In the Data View tool window, one can do the following:
Change the format of presentation. For example, if in the Format field one specifies
%.5f, then 5 digits will appear after dot; if one specifies%.2f, the presentation of the data will change to showing 2 digits after dot. See Python documentation for details.Close the viewer tab by clicking
 , and open a new one by clicking
  .
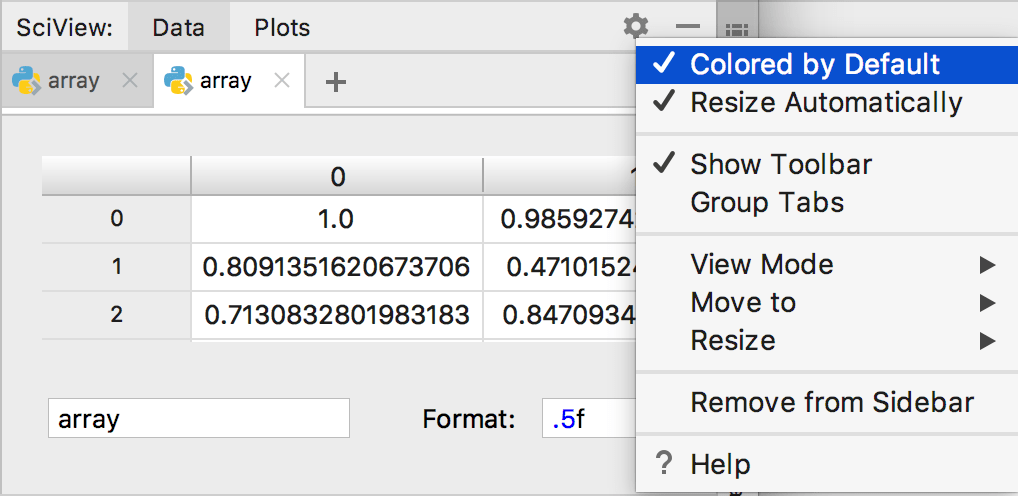
.Make the presentation black-and-white in the new tabs by clearing the check-command Colored by Default that appears in the drop-down menu
 . If this command is cleared, and a new DataFrame/array is opened, then the new presentation will be colorless.
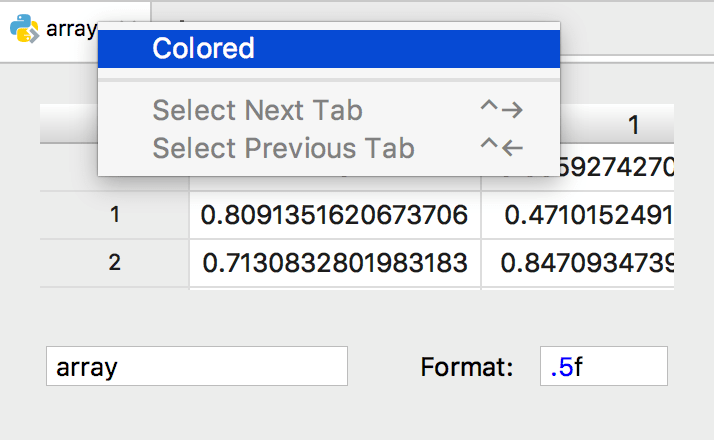
It's possible to change from the colored to colorless modes for the current tab by right-clicking a tab and selecting the check-command Colored:

Resize columns using the double-headed arrow
 :
:
Data View is a tool window, and as such, it inherits all the behaviors that are common to all the tool windows. Refer to the section Working with Tool Windows to learn more.