Monitor the Debug Information
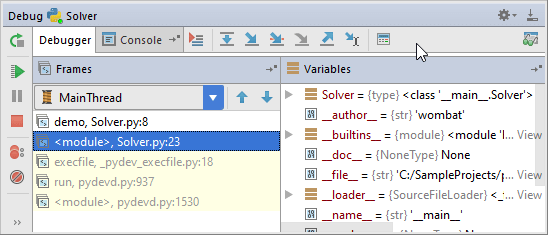
The information on a debugging session is displayed in the dedicated tabs of the Debug tool window named after the selected run/debug configuration.
For each session, use the Console tab to view the debugger messages and application output, and the Debug tab to monitor threads and frames.

When displaying and modifying local variables or watches values, PyCharm uses the Default Encoding setting for the current project or the IDE encoding if no encoding is specified at the project level.
Last modified: 26 June 2020