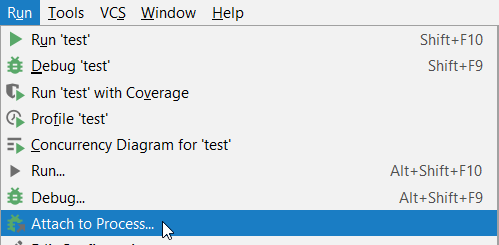
Attach to process
PyCharm provides a way to attach the debugger to to a Python local process, while running a Python script launched either from your operating system or using the PyCharm terminal, but NOT in the debug mode. Note that you cannot attach to a remote process.
First off, if you want to debug a program that can be started from PyCharm, the best way to do it is to start a local debugging session.
Prerequisites for Ubuntu users
If you are using PyCharm on Ubuntu (or probably, on some other Linux distribution), an error message ptrace: Operation not permitted may appear upon your first attempt to attach to a process. In this case, do one of the following:
To disable this restriction temporarily, enter the command:
echo 0 | sudo tee /proc/sys/kernel/yama/ptrace_scopeTo disable this restriction permanently, open the /etc/sysctl.d/10-ptrace.conf file for editing and change the line
kernel.yama.ptrace_scope = 1tokernel.yama.ptrace_scope = 0.To apply the changes immediately, enter the above command
echo 0 | sudo tee /proc/sys/kernel/yama/ptrace_scope.Alternatively, run
sudo service procps restartor restart your system.
You can find more details here.
Attach to a local process
Press Ctrl+Alt+F5 or choose from the main menu.

The list of running local processes is shown. Select the process to attach to.

If necessary, narrow down the list of processes by typing the first letters of its name or PID.
You might want to show only specific processes in the Attach to Process list. Add the required pattern to the corresponding field on the Build, Execution, Deployment | Python Debugger page of the IDE settings Ctrl+Alt+S For example, put "Scientific" if you want to attach only processes matching this string:

Proceed with debugging the same way as you usually do it in PyCharm (set breakpoints, step through, pause and resume the process, evaluate expressions, and so on)
Note that in case the process you have attached to does not provide debug information, breakpoints will be unavailable and stepping will be performed in the disassembly view.
Detach from a process
The procedure to detach from a remote process is the same as for stopping a local debug session, however, the effect is different. When you detach, the debugging session closes but the process continues to run.
Click the Stop
button on the main toolbar on in the Debug tool window.
Alternatively, click Stop
on the main toolbar or press Ctrl+F2, then select the session to be closed.