Creating Web Applications with Flask
This tutorial explains how to develop a web-based application using the Flask web framework. Our MeteoMaster application processes meteo data stored in a database and presents it in the form of the following charts:
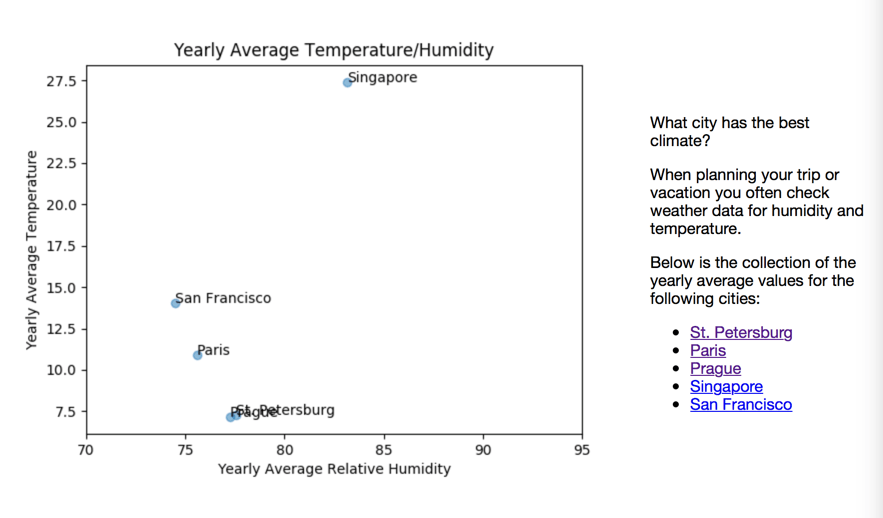
Scatter chart — a cumulative report of the average yearly temperature and humidity in Prague, St. Petersburg, San Francisco, Paris , and Singapore.
Line charts — Average monthly temperature and humidity in each city.
Staying Above the Weather: Application Overview
You will use various Web technologies to implement the following application functions:
Function | Technology |
|---|---|
Meteo data operations | SQLite database to store data, SQLAlchemy package to perform operations with the database in Python code. |
Graphical representation | matplotlib package to plot graphs. |
Viewing and editing content | HTML to create page views and Jinja to create smart templates. |
Managing content | Flask to orchestrate the application content. |
The MeteoMaster is a web application that comprises the following components:

- Main page
Application entry point that renders the scatter chart and provides links to the detailed summary of climate in a particular city.
- City
A series of pages with the detailed information about climate in each city.
- Login
Authentication page. One needs to enter the valid credentials to edit meteo data.
- Edit
A series of pages for editing city specific data.
Each HTML page has a corresponding Flask view implemented in Python code.
Creating a Flask application in PyCharm
Create a basic Flask project as described in Creating a Flask Project to start prototyping the application.
Select Flask in the New Project dialog.

In the Location field, provide the path to the project location and type the MeteoMaster as the project name. Leave the rest of the settings default and save the changes.
Click Shift+F10 to run the default application. In the Run tool window, click the hyperlink and preview the target page.

Now install all the packages required for the MeteoMaster application. The easiest way to do that is to use project dependencies (see Use requirements.txt). Right-click the project root and select , then specify requirements.txt as the filename and add the following list of the dependencies to it.
Click==7.0 cycler==0.10.0 Flask==1.0.2 Jinja2==2.10 kiwisolver==1.0.1 MarkupSafe==1.1.0 matplotlib==3.0.2 numpy==1.15.4 pyparsing==2.3.0 python-dateutil==2.7.5 six==1.11.0 SQLAlchemy==1.2.14 Werkzeug==0.14.1Click the Install requirements link to proceed with installation of the packages.

Setting up a Database
Now, set up a data source for your application. With PyCharm, it is quite straightforward.
Download the predefined database with the meteo data for five cities from the following location:
https://github.com/allaredko/flask-tutorial-demo/blob/master/user_database
Save the user_database file in the project root directory.
Double-click the added file and open the Database tool window.

If you haven't installed the SQLite database driver yet, click the
 and click the warning message to install the missing driver.
You should see the following tables in the
user_databasedatabase:cityandmeteo. Double-click each table to preview the data. Thecitytable has three columns:city_id,city_name, andcity_climate(a brief text description of the city climate). Themeteotable has four columns:city_id,month,average_humidity, andaverage_temperature. A foreign key is defined for thecity_idcolumn of thetableto set a relation between two tables.>
Optionally, right-click user_database in the Database tool window and select . In the Data Sources and Drivers dialog, click Test connection to ensure that the data source has been configured properly.

Create a Python file, user_database.py, to work with the newly created database. Use SQLAlchemy declarative base syntax to describe the database.
metadata = MetaData() engine = create_engine('sqlite:///user_database', connect_args={'check_same_thread': False}, echo=False) # echo=False Base = declarative_base() db_session = sessionmaker(bind=engine)() # Table city class City(Base): __tablename__ = 'city' city_id = Column(Integer, primary_key=True) city_name = Column(String) city_climate = Column(String) city_meteo_data = relationship("Meteo", backref="city") # Table meteo class Meteo(Base): __tablename__ = 'meteo' id = Column(Integer, primary_key=True) city_id = Column(ForeignKey('city.city_id')) month = Column(String) average_humidity = Column(Integer) average_temperature = Column(Float)Instead of manually adding import statements for the code fragment, apply the suggested quick fixes: just click the bulb icon (or press Alt+Enter).

Now that you have defined the tables and their relationship, add the following functions to retrieve data from the database:
# Retrieving data from the database def get_cities(): return db_session.query(City) # Generating the set of average temperature values for a particular city def get_city_temperature(city): return [month.average_temperature for month in city.city_meteo_data] # Generating the set of average humidity values for a particular city def get_city_humidity(city): return [month.average_humidity for month in city.city_meteo_data] data = get_cities() MONTHS = [record.month for record in data[0].city_meteo_data] CITIES = [city.city_name for city in data]
Plotting the scatter chart
You are ready to retrieve data and build the first graph - the scatter chart with the yearly average temperature and humidity in each city. Use the matplotlib library to set up the graph and assign the values.
Create yet another Python file, charts.py, and paste the following code fragment:
import matplotlib.pyplot as plt from user_database import data, get_city_temperature, get_city_humidity, CITIES yearly_temp = [] yearly_hum = [] for city in data: yearly_temp.append(sum(get_city_temperature(city))/12) yearly_hum.append(sum(get_city_humidity(city))/12) plt.clf() plt.scatter(yearly_hum, yearly_temp, alpha=0.5) plt.title('Yearly Average Temperature/Humidity') plt.xlim(70, 95) plt.ylabel('Yearly Average Temperature') plt.xlabel('Yearly Average Relative Humidity') for i, txt in enumerate(CITIES): plt.annotate(txt, (yearly_hum[i], yearly_temp[i])) plt.show()The quickest way to preview the graph is to use the Shift+F10 shortcut. PyCharm renders the scatter chart in the SciView tool window. You can use the Plots tab to preview the generated graph.

Now save the graph into an image so that you can add it to the main page of your application. Replace
plt.show()with the fragment that utilizes thesavefig(img)function:from io import BytesIO import matplotlib.pyplot as plt from user_database import data, MONTHS, get_city_temperature, get_city_humidity, CITIES def get_main_image(): """Rendering the scatter chart""" yearly_temp = [] yearly_hum = [] for city in data: yearly_temp.append(sum(get_city_temperature(city))/12) yearly_hum.append(sum(get_city_humidity(city))/12) plt.clf() plt.scatter(yearly_hum, yearly_temp, alpha=0.5) plt.title('Yearly Average Temperature/Humidity') plt.xlim(70, 95) plt.ylabel('Yearly Average Temperature') plt.xlabel('Yearly Average Relative Humidity') for i, txt in enumerate(CITIES): plt.annotate(txt, (yearly_hum[i], yearly_temp[i])) img = BytesIO() plt.savefig(img) img.seek(0) return img
Creating the Main Page
Set up the main page of the application and create a view for the scatter chart.
Replace the
app.route()code fragment in the app.py file with the following code:@app.route('/') def main(): """Entry point; the view for the main page""" cities = [(record.city_id, record.city_name) for record in data] return render_template('main.html', cities=cities) @app.route('/main.png') def main_plot(): """The view for rendering the scatter chart""" img = get_main_image() return send_file(img, mimetype='image/png', cache_timeout=0)Apply the suggested quick fixes to add the missing import statements.
Note that PyCharm highlights main.html because you have not created this file yet.

With PyCharm intention action you can quickly create the missing template file. Press Alt+Enter and select Create template main.html from the context menu. Confirm the name and location of the template file and click OK. As the result, the main.html will be added to the templates directory. Open the newly added file and paste the following code into it:
<!DOCTYPE html> <html lang="en"> <head> <meta charset="UTF-8"> <link href="../static/style.css" rel="stylesheet" type="text/css"> <title>Typical Climate</title> </head> <body> <div id="element1"> <img src="{{ url_for('main_plot') }}" alt="Image"> </div> <div id="element2"> <p>What city has the best climate?</p> <p>When planning your trip or vacation you often check weather data for humidity and temperature.</p> <p>Below is the collection of the yearly average values for the following cities: </p> <ul> {% for city_id, city_name in cities %} <li><a href="">{{ city_name }}</a></li> {% endfor %} </ul> </div> </body> </html>Note that
{{ city_name }}in this fragment is a Jinja2 template variable used to pass thecity_namePython variable to the HTML template.Also create the stylesheet to set up font and layout settings for all HTML pages in your application. Right-click the static directory and select , then specify the name of the css file, style.css, and paste the following style definitions:
body { font-family: "Helvetica Neue", Helvetica, Arial, sans-serif; } #element1 { display: inline-block; } #element2 { display: inline-block; vertical-align: top; margin-top: 90px; alignment: left; width: 25%; }When you run the application for the very first time, PyCharm automatically generated the Run/Debug configuration. You can use it to run the modified application any time you want to evaluate the result.

Click the
 and follow the http://127.0.0.1:5000/ link in the Run tool window. You should expect to see the following page:
Plotting line charts
To provide application users with the detailed information about climate of a particular city, render the line charts with the relevant information.
Modify the charts.py file by adding the
get_city_imagefunction:def get_city_image(city_id): """Rendering line charts with city specific data""" city = data.get(city_id) city_temp = get_city_temperature(city) city_hum = get_city_humidity(city) plt.clf() plt.plot(MONTHS, city_temp, color='blue', linewidth=2.5, linestyle='-') plt.ylabel('Mean Daily Temperature', color='blue') plt.yticks(color='blue') plt.twinx() plt.plot(MONTHS, city_hum, color='red', linewidth=2.5, linestyle='-') plt.ylabel('Average Relative Humidity', color='red') plt.yticks(color='red') plt.title(city.city_name) img = BytesIO() plt.savefig(img) img.seek(0) return imgThis function plots two linear charts: monthly Mean Daily Temperature and Average Relative Humidity for each city. Similarly to the
get_main_imagefunction, it saves the chart in an image.Create one more .html file to show the line charts.
Right-click the templates directory in the project root and select , then enter, city.html as the file's name, and paste the following code in the newly created file:
- <!DOCTYPE html> <html lang="en"> <head> <meta charset="UTF-8"> <link href="../static/style.css" rel="stylesheet" type="text/css"> <title>{{ city_name }}</title> </head> <body> <div id="element1"> <img src="{{ url_for('city_plot', city_id=city_id) }}" alt="Image"> </div> <div id="element2"> <p>This graph shows mean daily temperature and average relative humidity in {{ city_name }}.</p> <p> {{ city_climate }}</p> <hr/> <p><a href="/">Back to the main page</a></p> </div> </body> </html>
The remaining step is to create two more views using the
Flask.routefunction. Add the following code fragment to the app.py file:@app.route('/city/<int:city_id>') def city(city_id): """Views for the city details""" city_record = data.get(city_id) return render_template('city.html', city_name=city_record.city_name, city_id=city_id, city_climate=city_record.city_climate) @app.route('/city<int:city_id>.png') def city_plot(city_id): """Views for rendering city specific charts""" img = get_city_image(city_id) return send_file(img, mimetype='image/png', cache_timeout=0,)Don't forget to use the quick fixes Alt+Enter to add the missing import statements.
Now modify the main.html file to populate the list of the cities with the links to the corresponding city/* page. Replace
<li><a href="">{{ city_name }}</a></li>with<li><a href="{{ url_for('city', city_id=city_id) }}">{{ city_name }}</a></li>.
Rerun the Run/Debug configuration to restart the application and click the link that leads to Paris. You should expect to get navigated to the city/2 page.

Creating a Login Form
By this time, you have created a fully functional application that retrieves meteo data from the database and present them as charts. However, in real life you typically want to edit the data. Reasonably, editing should only be permitted to authorized users, so, let's create a login form.
Right-click the templates directory in the project root and select , then enter, login.html as the file's name, and paste the following code in the newly created file:
<!DOCTYPE html> <html lang="en"> <head> <meta charset="UTF-8"> <link rel="stylesheet" type="text/css" href="../static/style.css"> <title>Login form </title> </head> <body> <p>Login to edit the meteo database: </p> <div class="container"> <form action="" class="form-inline" method="post"> <input type="text" class="form-control" placeholder="Username" name="username" value="{{ request.form.username }}"> <input type="password" class="form-control" placeholder="Password" name="password" value="{{ request.form.password }}"> <input class="btn btn-default" type="submit" value="Login"> </form> <p>{{ error }} </p> </div> </body> </html>This code implements a typical login form with the Username and Password fields.
Add the following code to the app.py file to create the Flask view for the login form and to control the login session.
@app.route('/login/<int:city_id>', methods=["GET", "POST"]) def login(city_id): """The view for the login page""" city_record = data.get(city_id) try: error = '' if request.method == "POST": attempted_username = request.form['username'] attempted_password = request.form['password'] if attempted_username == 'admin' and attempted_password == os.environ['USER_PASSWORD']: session['logged_in'] = True session['username'] = request.form['username'] return redirect(url_for('edit_database', city_id=city_id)) else: print('invalid credentials') error = 'Invalid credentials. Please, try again.' return render_template('login.html', error=error, city_name=city_record.city_name, city_id=city_id) except Exception as e: return render_template('login.html', error=str(e), city_name=city_record.city_name, city_id=city_id) def login_required(f): @wraps(f) def wrap(*args, **kwargs): """login session""" if 'logged_in' in session: return f(*args, **kwargs) else: pass return redirect(url_for('login')) return wrap app.secret_key = os.environ['FLASK_WEB_APP_KEY']Use the Alt+Enter shortcut to add the missing import statements. Note that this code fragment introduces two environmental variables:
USER_PASSWORDandFLASK_WEB_APP_KEY.You can record the values of the newly created environmental variables in the MeteoMaster Run/Debug configuration as this is a safer way to store security sensitive information than hardcoding it in the app.py file.
Go to the Run/Debug configurations list on the top-right of the editor and select Edit configurations. Click the
 icon in the Environmental variables field and add two variables.
Modify the
<div id="element2">element in the city.html file to accommodate login facilities:<p>This graph shows mean daily temperature and average relative humidity in {{ city_name }}.</p> <p> {{ city_climate }}</p> {% if session['logged_in'] %} <p>Want to add more data?</p> <p>Go and <a href="{{ url_for('edit_database', city_id=city_id) }}">edit</a> the meteo database.</p> {% else %} <p>Want to edit meteo data?</p> <p>Please <a href="{{ url_for('login', city_id=city_id) }}">login</a> first.</p> {% endif %} <hr/> <p><a href="/">Back to the main page</a></p>Restart the application and click any city link, then click the login link in the "Please login first" sentence. You should expect to see the login form.

For time being, this form doesn't enable editing because you have not implemented the corresponding page. Meanwhile, you can try to enter any incorrect password to check if it is processed with the message: "Invalid credentials. Please, try again."
Editing the data
The last remaining step is to enable editing of the meteo data.
Right-click the templates directory in the project root and select , then enter, edit.html as the file's name, and paste the following code in the newly created file:
<!DOCTYPE html> <html lang="en"> <head> <meta charset="UTF-8"> <link rel="stylesheet" type="text/css" href="../static/style.css"> <title>Edit meteo data for {{ city_name }}</title> </head> <body> <p>Edit the data for {{ city_name }} as appropriate:</p> <div class="container"> <form name="meteoInput" action="" class="form-inline" method="post"> <table> <tr> <td>Month</td> <td colspan="2" align="center">Average Temperature</td> <td colspan="2" align="center">Average Humidity</td> </tr> {% for month in months %} <tr> <td>{{ month }}</td> <td> <input placeholder="20" class="form-control" name="temperature{{ loop.index0 }}" value="{{ meteo[0][loop.index0]}}" type="range" min="-50.0" max="50.0" step="0.01" oninput="temp_output{{ loop.index0 }}.value=this.value" > </td> <td> <output name="temp_output{{ loop.index0 }}">{{ '%0.2f' % meteo[0][loop.index0]|float }}</output> <label> C</label> </td> <td> <input placeholder="20" class="form-control" name="humidity{{ loop.index0 }}" value="{{ meteo[1][loop.index0]}}" type="range" min="0" max="100" oninput="hum_output{{ loop.index0 }}.value=this.value"> </td> <td> <output name="hum_output{{ loop.index0 }}">{{ meteo[1][loop.index0]}}</output> <label> %</label> </td> </tr> {% endfor %} </table> <input class="btn btn-default" type="submit" value="Save"> </form> <p>{{ error }}</p> </div> </body> </html>This fragment also utilizes a Jinjia2 template to process the input data and pass it to the Python code that performs a commit to the database.
Add one more code fragment to the app.py file that creates a Flask view for the edit page, processes input data, and updates the database:
@app.route('/edit/<int:city_id>', methods=["GET", "POST"]) @login_required def edit_database(city_id): """Views for editing city specific data""" month_temperature = [] month_humidity = [] city_record = data.get(city_id) meteo = [get_city_temperature(city_record), get_city_humidity(city_record)] try: if request.method == "POST": # Get data from the form for i in range(12): # In a production application we ought to validate the input data month_temperature.append(float(request.form[f'temperature{i}'])) month_humidity.append(int(request.form[f'humidity{i}'])) # Database update for i, month in enumerate(city_record.city_meteo_data): month.average_temperature = month_temperature[i] month.average_humidity = month_humidity[i] db_session.commit() return redirect(url_for('main', city_id=city_id)) else: return render_template('edit.html', city_name=city_record.city_name, city_id=city_id, months=MONTHS, meteo=meteo) except Exception as error: return render_template('edit.html', city_name=city_record.city_name, city_id=city_id, months=MONTHS, meteo=meteo, error=error)Don't forget to add the missing import statements. See the complete code of the app.py file in the project repository.
With this step, you have completed the task of creating a Flask-based application that interacts with the database. Now you've got full power over the weather. Go and modify meteo data for any of the cities, so that the changes be prominent on the charts. Then preview the changes.