Run and debug Jupyter notebook code cells
Code fragments in a Jupyter notebook file are structured as executable cells. Each cell is marked with the #%% comment and can be executed independently by clicking the ![]() icon in the gutter. To execute all cells at once, click
icon in the gutter. To execute all cells at once, click ![]() on the Jupyter toolbar.
on the Jupyter toolbar. 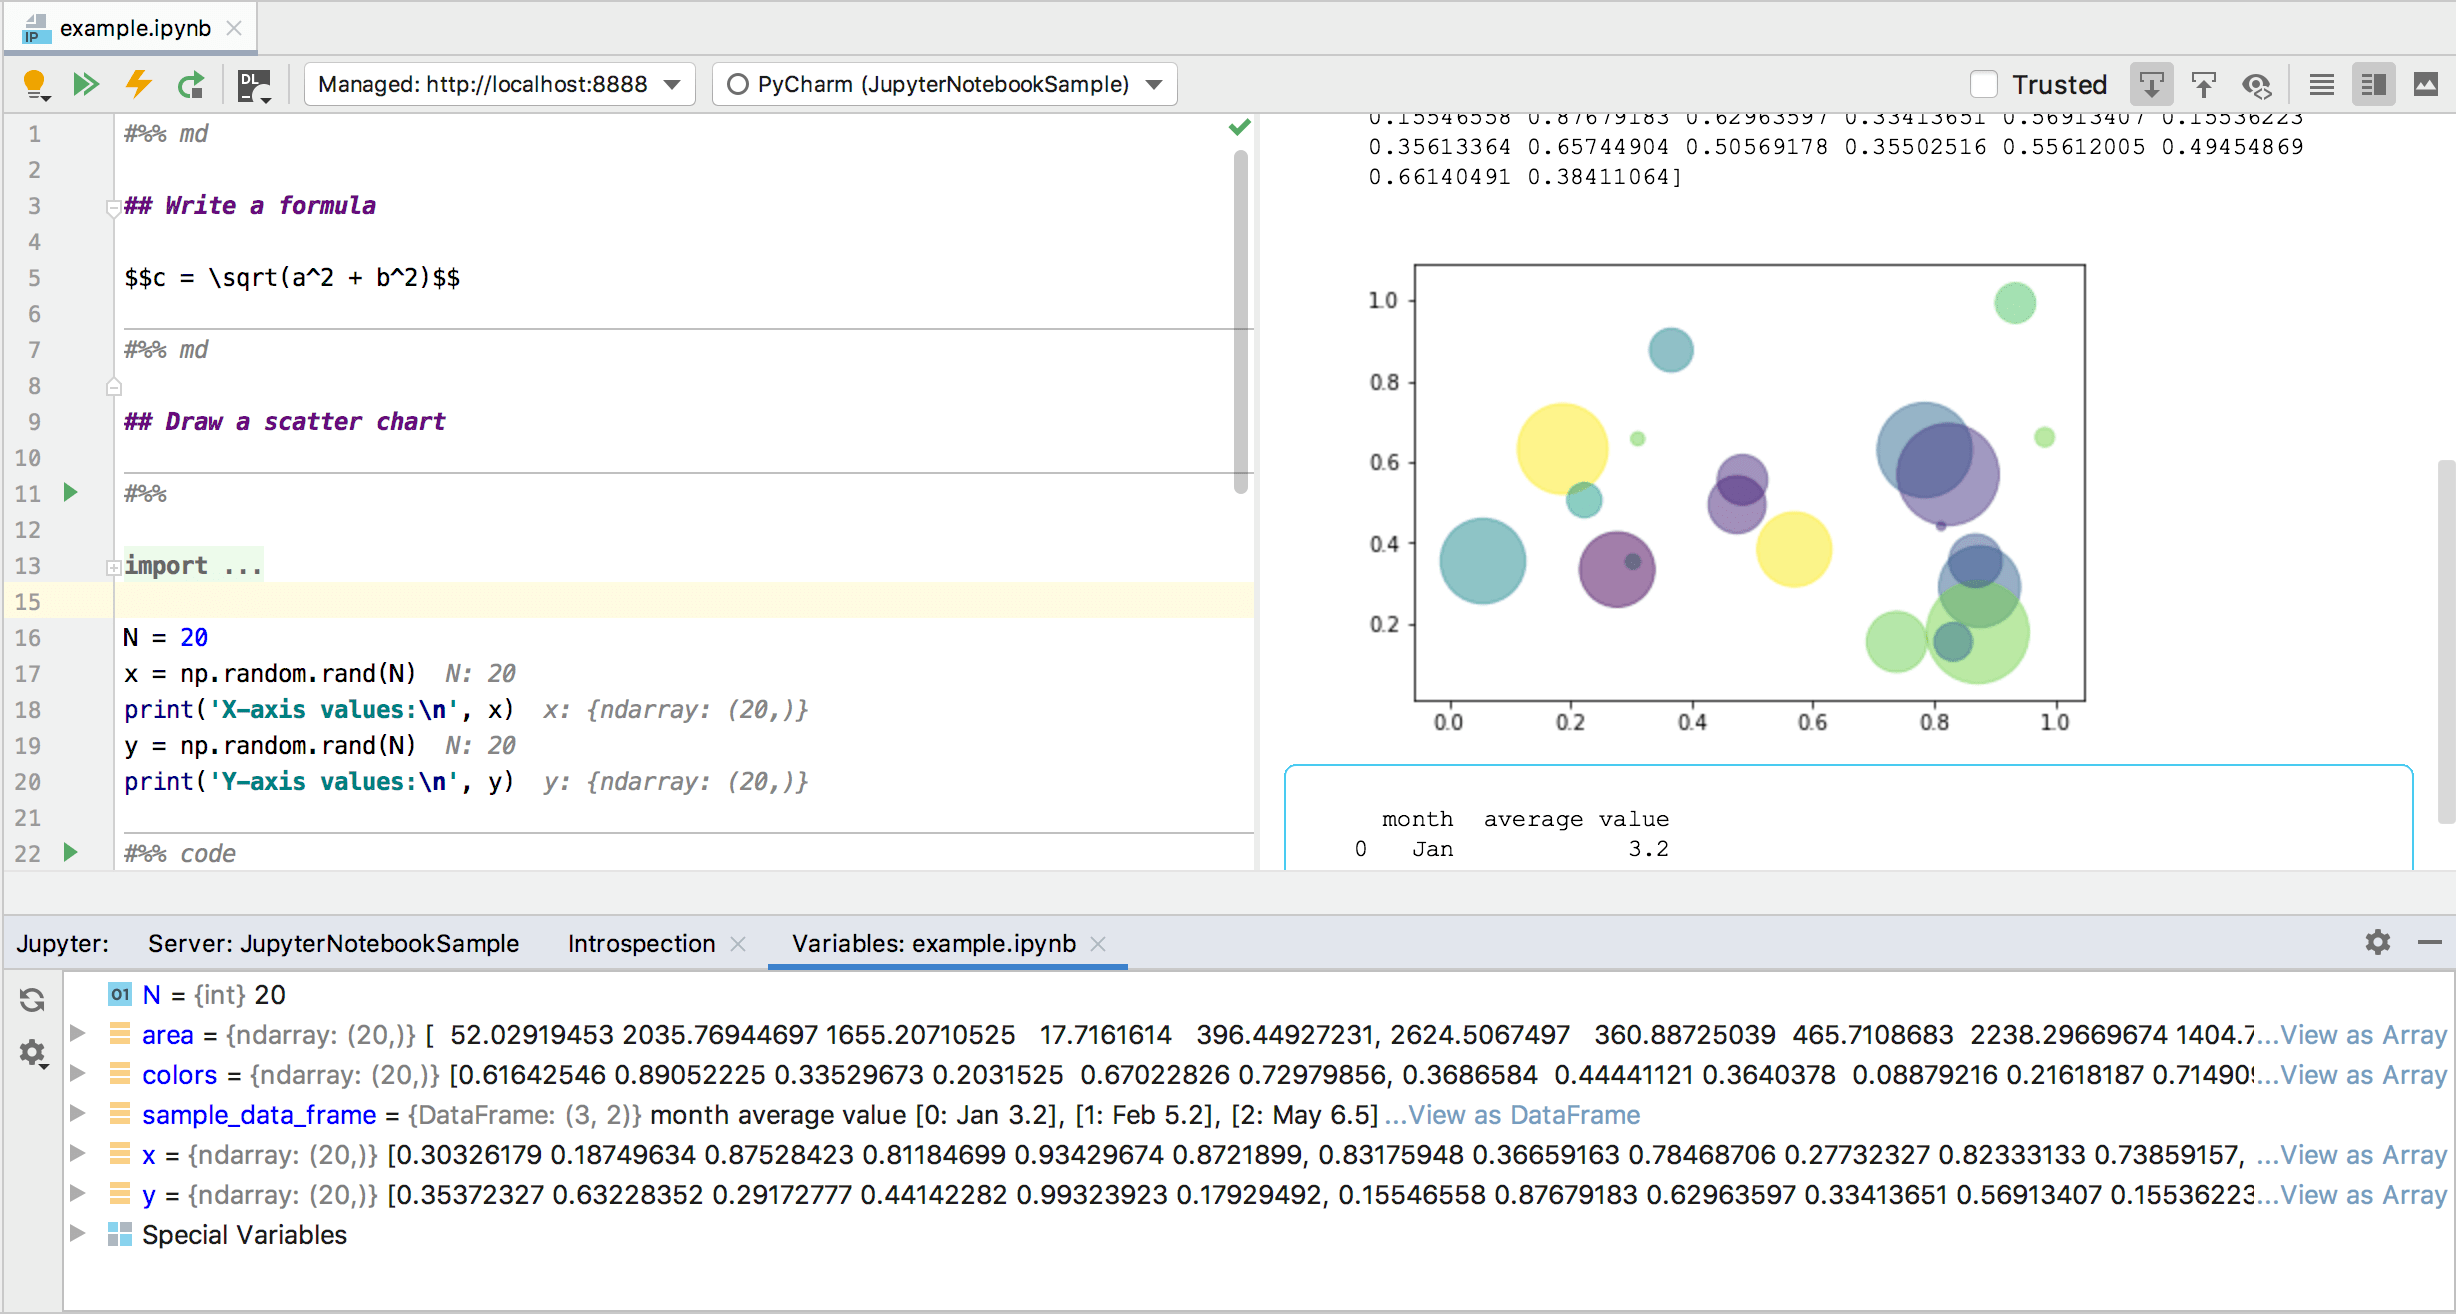
Run code cells
For the target cell press Ctrl+Enter. Alternatively, you can click the
 icon and select Run Cell. PyCharm launches the Jupyter server, executes the code cell, and renders the output in the Preview pane.
When executing one cell at a time, mind code dependencies. For example, the second cell in the code fragment uses the variables defined in the first cell. So, if you modify the
Nvalue, the changes will be reflected in the scatter chart only after the first cell gets executed.To execute all code cells in your notebook, click
 on the notebook toolbar or press Ctrl + Shift + Alt + Enter. To run all code cells above the current cell and handle possible code dependencies, click
  on the notebook toolbar and select the Run All Above command from the quick list.
When you stop the server and change the server or kernel, you have to execute all cells with dependencies again, because execution results are valid for the current server session only.
View variables
When you execute a cell, the Variables tab of the Jupyter tool window opens automatically.

By default, variables are loaded asynchronously. To change the loading policy, click
 in the Variables tab, select Variables Loading Policy, and select one of the available modes. See Managing Variables Loading Policy for more details.
You can click the link to the right of the variable to preview its values in the tabular form.
In addition to previewing values of the variables in the Variables tab, you can watch the values of the variable usages in the editor. Note that variable assignments are not shown.

This option is enabled by default. To disable it, deselect the Show Inline Values in the Editor checkbox in the project settings ().
When you work with a substantial number of code cells, you can effectively navigate between the Editor and Preview panes by using auto scrolling.
Jump to the target output fragment or target code cell
Enable auto scrolling from the source by clicking the
 icon, then select a code cell in the Editor pane. You will be positioned on the target output fragment in the Preview pane.
Enable auto scrolling to the source code by clicking the
 icon on the Jupyter toolbar, then select an arbitrary output fragment in the Preview pane. You'll be positioned on the source code cell in the Editor pane.
PyCharm provides the full-functional Jupyter Notebook Debugger.
Debug code in Jupyter notebook
Set the breakpoints in the selected cell and press Alt + Shift + Enter for Windows or ⌥⇧↩ for macOS. Alternatively, you can click
in the gutter next to the target cell and select from the menu.The Jupyter Notebook Debugger tool window opens.

Use the stepping toolbar buttons stepping toolbar to choose on which line you want to stop next and switch to the Debugger tab to preview the variable values:

Debugging is performed within a single code cell. However, if your code cell calls a function from any cell that has been already debugged, you can step into it. The related breakpoints will also work. Note that the cell with the function must be debugged not just executed.

Similarly, you can step into a function called from a Python file that is located in the same project.

Proceed with the debugging steps to complete the execution of the cell.

Clear the notebook output
To erase the execution output in the Preview area, click
on the Jupyter notebook toolbar and select the command from the quick list. Evaluate the results in the Preview area.
With PyCharm you can always quickly preview reference documentation for a particular variable, type, or argument.
Preview reference documentation
To view reference information for any element of a particular code cell, place the caret within the target code cell and type
? <type/variable/argument>. (in this example, you will preview documentation forplt.scatter). Note that a code element should be accessible within the code cell.Execute the cell. The Introspection tab opens in the Jupyter tool window.

Preview reference documentation in the Introspection tab.
Note that the Introspection tab shows documentation for the latest requested code element. Even though you proceed with executing other code cells, restart the server, or delete the line with your request, this information will be shown.
Stepping actions
Item | Tooltip and Shortcut | Description |
|---|---|---|
Action available on the Debugger toolbar. | ||
| Step Over F8 | Click this button to execute the program until the next line in the current method or file, skipping the methods referenced at the current execution point (if any). If the current line is the last one in the method, execution steps to the line executed right after this method. |
| Step Into F7 | Click this button to have the debugger step into the method called at the current execution point. |
| Step Out Shift+F8 | Click this button to have the debugger step out of the current method, to the line executed right after it. |
Additional stepping actions available by clicking | ||
| Force Step Over | Steps over the current line of code and takes you to the next line even if the highlighted line has method calls in it. If there are breakpoints in the called methods, they are ignored. |
| Smart Step Into | Smart step into is helpful when there are several method calls on a line, and you want to be specific about which method to enter. This feature allows you to select the method call you are interested in. |
| Run to Cursor Alt+F9 | Click this button to resume program execution and pause until the execution point reaches the line at the current cursor location in the editor. No breakpoint is required. Actually, there is a temporary breakpoint set for the current line at the caret, which is removed once program execution is paused. Thus, if the caret is positioned at the line which has already been executed, the program will be just resumed for further execution, because there is no way to roll back to previous breakpoints. This action is especially useful when you have stepped deep into the methods sequence and need to step out of several methods at once. If there are breakpoints set for the lines that should be executed before bringing you to the specified line, the debugger will pause at the first encountered breakpoint. |
| Force Run to Cursor | Continues the execution until the position of the caret is reached. All breakpoints on the way are ignored. |