Spark monitoring
With the Spark plugin, you can monitor your Spark cluster and submitted jobs right in the IDE.
In this chapter:
Connect to a Spark server
In the Big Data Tools window, click
 and select Spark.
In the Big Data Tools dialog that opens, specify the connection parameters:

Name: the name of the connection to distinguish it between the other connections.
URL: the URL of the Spark History server (it is usually running on port 18080).
Optionally, you can set up:
Per project: select to enable these connection settings only for the current project. Clear the checkbox if you want this connection to be visible in other projects.
Enable connection: clear the checkbox if you want to disable this connection. By default, the newly created connections are enabled.
Enable tunneling: creates an SSH tunnel to the remote host. It can be useful if the target server is in a private network but an SSH connection to the host in the network is available.
Select the checkbox and specify a configuration of an SSH connection (click ... to create a new SSH configuration).
Enable HTTP basic authentication: connection with the HTTP authentication using the specified username and password.
Proxy: select if you want to use IDE proxy settings or if you want to specify custom proxy settings.
Once you fill in the settings, click Test connection to ensure that all configuration parameters are correct. Then click OK.
Establish connection from Zeppelin using running job
If you have the Zeppelin plugin, you can quickly connect to a Spark server by opening a Spark job from a Zeppelin notebook.
In a Zeppelin notebook that involves Spark, run a paragraph.
Click the Open job link. In the notification that opens, click link.

If you already have a connection to the Spark History server where the job is running, click Select connection and select it from the list.
In the Big Data Tools dialog that opens, verify the connection settings and click Test connection. If the connection has been established successfully, click OK to finalize configuring.
Once you have established a connection to the Spark server, the Spark monitoring tool window appears.

At any time, you can open the connection settings in one of the following ways:
Go to the Tools | Big Data Tools Settings settings page Ctrl+Alt+S.
Open the Big Data Tools tool window (), select a Spark connection, and click
 .
.Click
 in any tab of the Spark monitoring tool window.
When you select an application in the Spark monitoring tool window, you can use the following tabs to monitor data:
Info: high-level information on the submitted application, such as App id or Attempt id.
Jobs: a summary of the application jobs. Click a job to see more details on it. Use the Visualization tab to view the job DAG.
Stages: details of each stage.
Environment: the values for the environment and configuration variables.
Executors: a process launched for an application that runs tasks and keeps data in memory or disk storage across them. Use the Logs tab to view the executor stdout and stderr logs.
Storage: persisted RDDs and DataFrames.
SQL: details about SQL queries execution (if used by the application).
You can also preview info on Tasks, units of work that sent to one executor.
For more information about types of data, refer to Spark documentation.
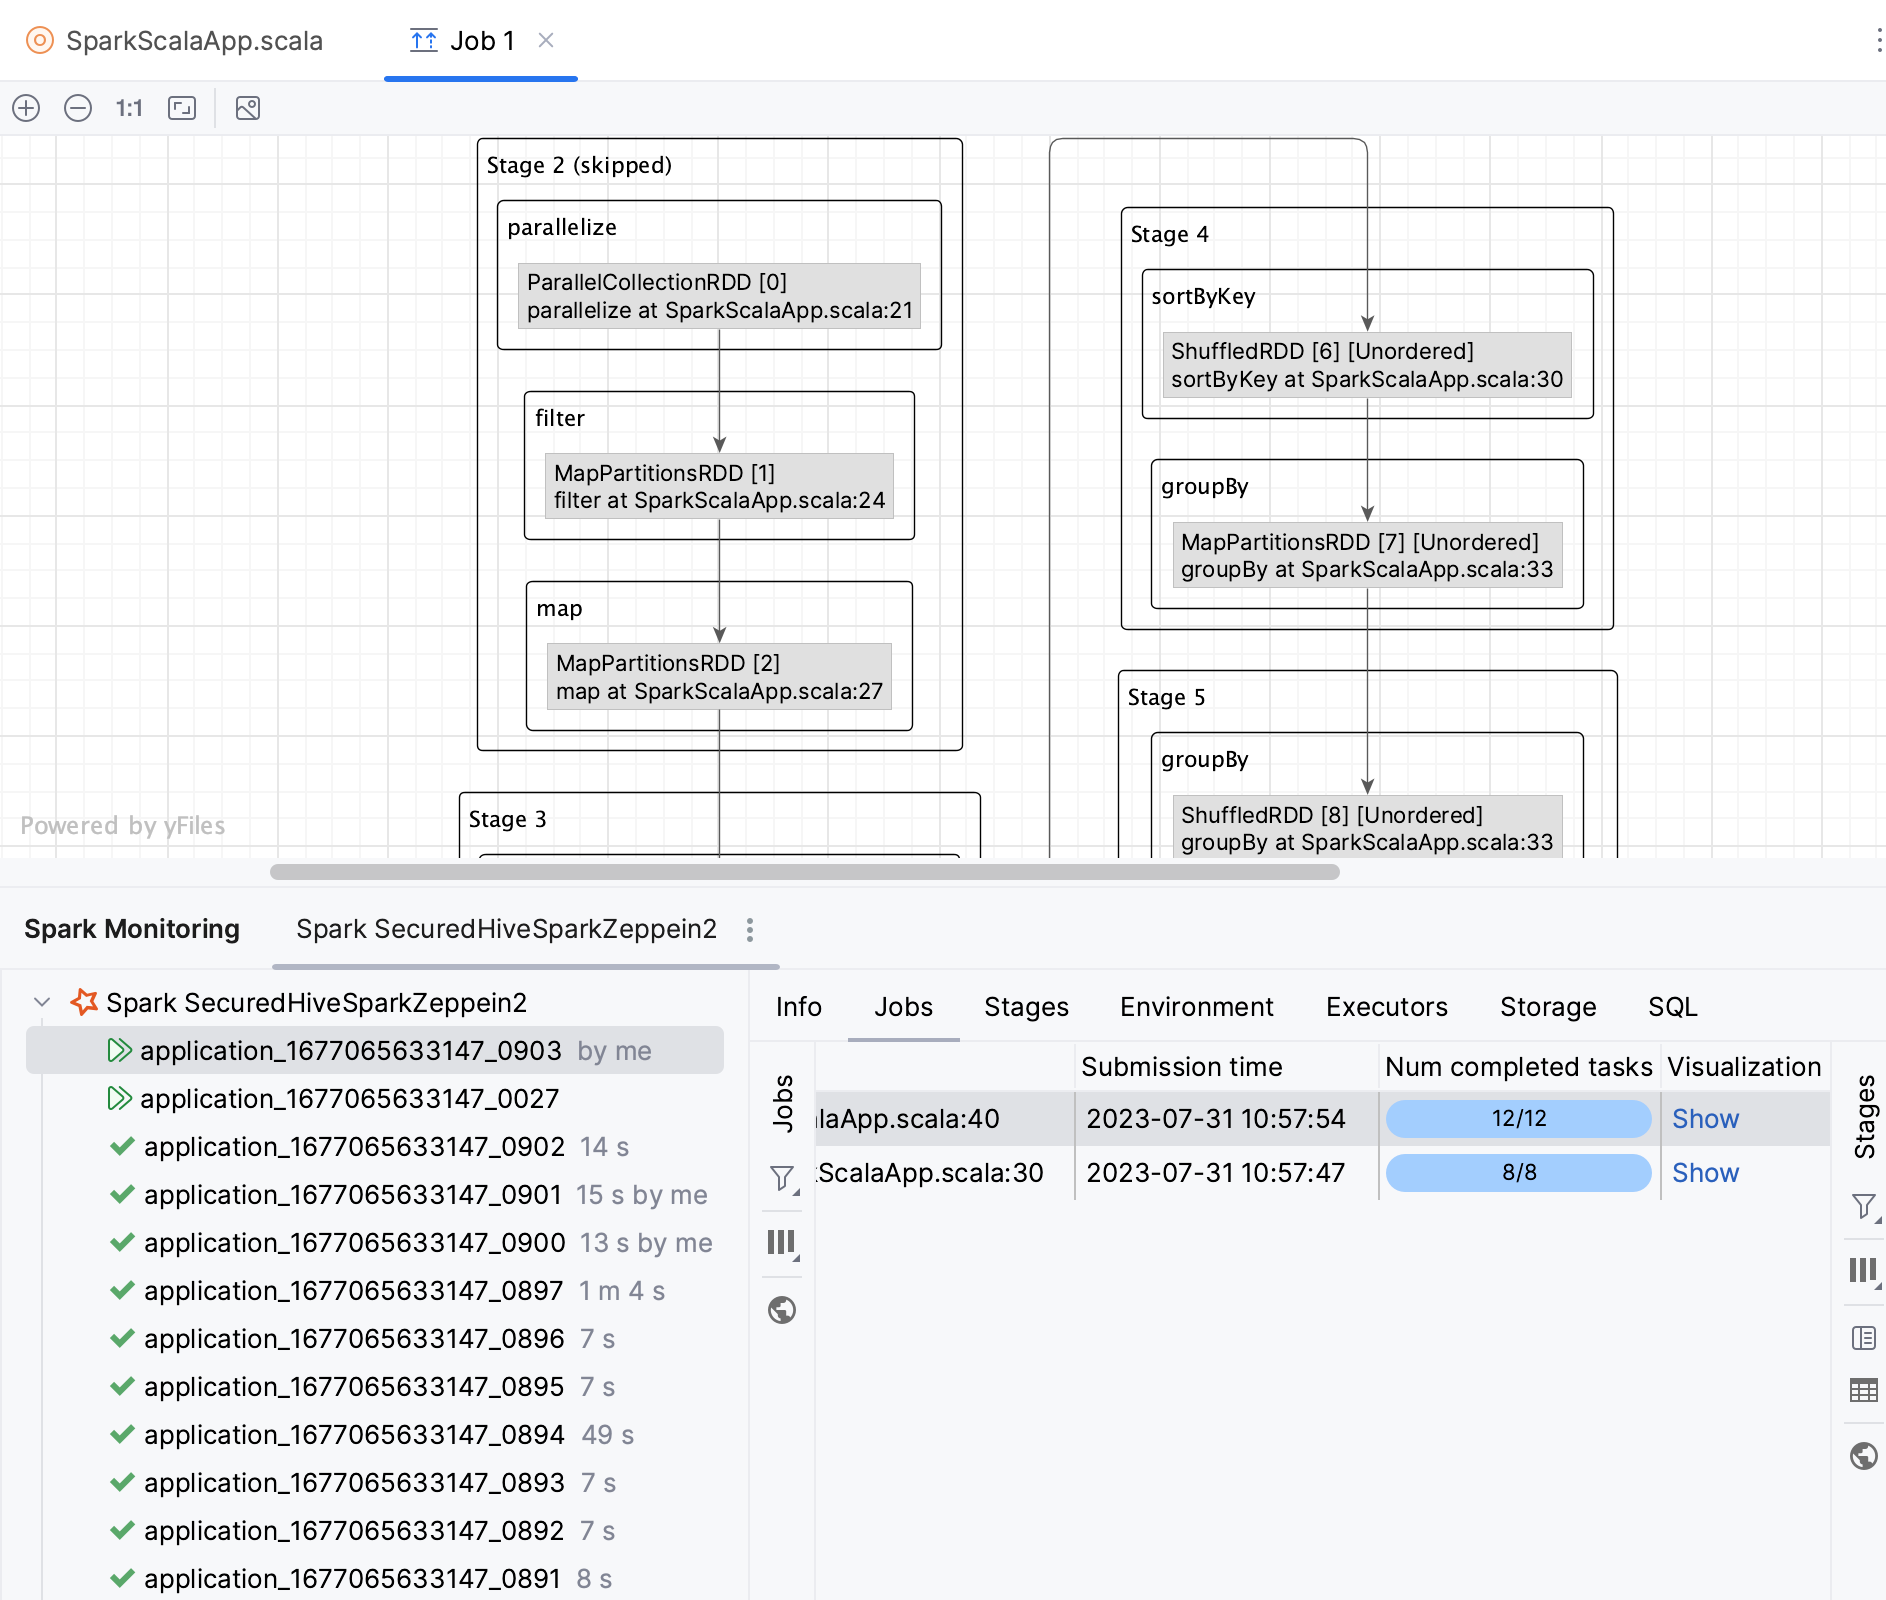
Navigate to source code from DAG graphs
A DAG (Directed Acyclic Graph) represents the logical execution plan of a Spark job. Just like in Spark UI, you can visualize the DAG of a Spark job. With PyCharm, you can also quickly navigate from a DAG to a corresponding piece of code in your source file.
Open the Spark monitoring tool window: .
Select an application and open the Jobs tab.
In the Visualization column, click Show.
This will open the job visualization in a new editor tab.
In a graph, double-click any operation.
You will be redirected to your source code file, to the corresponding operation.
Filter out the monitoring data
In the Spark monitoring tool window, use the following filters to filter applications:
Filter: type an application name or id.
Limit: change the limit of displayed applications or select All to show all of them.
Started: filter applications by the start time or select Any.
Finished: filter applications by the completion time or select Any.
 : show only running or completed applications.

In the Jobs, Stages, and SQL tabs, you can also use
to filter data by status.
At any time, you can click ![]() in the Spark monitoring tool window to manually refresh the monitoring data. Alternatively, you can configure the automatic update within a certain time interval using the list located next to the Refresh button.
in the Spark monitoring tool window to manually refresh the monitoring data. Alternatively, you can configure the automatic update within a certain time interval using the list located next to the Refresh button.