UML class diagrams
Enable the Diagrams plugin
This functionality relies on the Diagrams plugin, which is bundled and enabled in PyCharm by default. If the relevant features aren't available, make sure that you didn't disable the plugin.
Press Ctrl+Alt+S to open the IDE settings and then select .
Open the Installed tab, find the Diagrams plugin, and select the checkbox next to the plugin name.
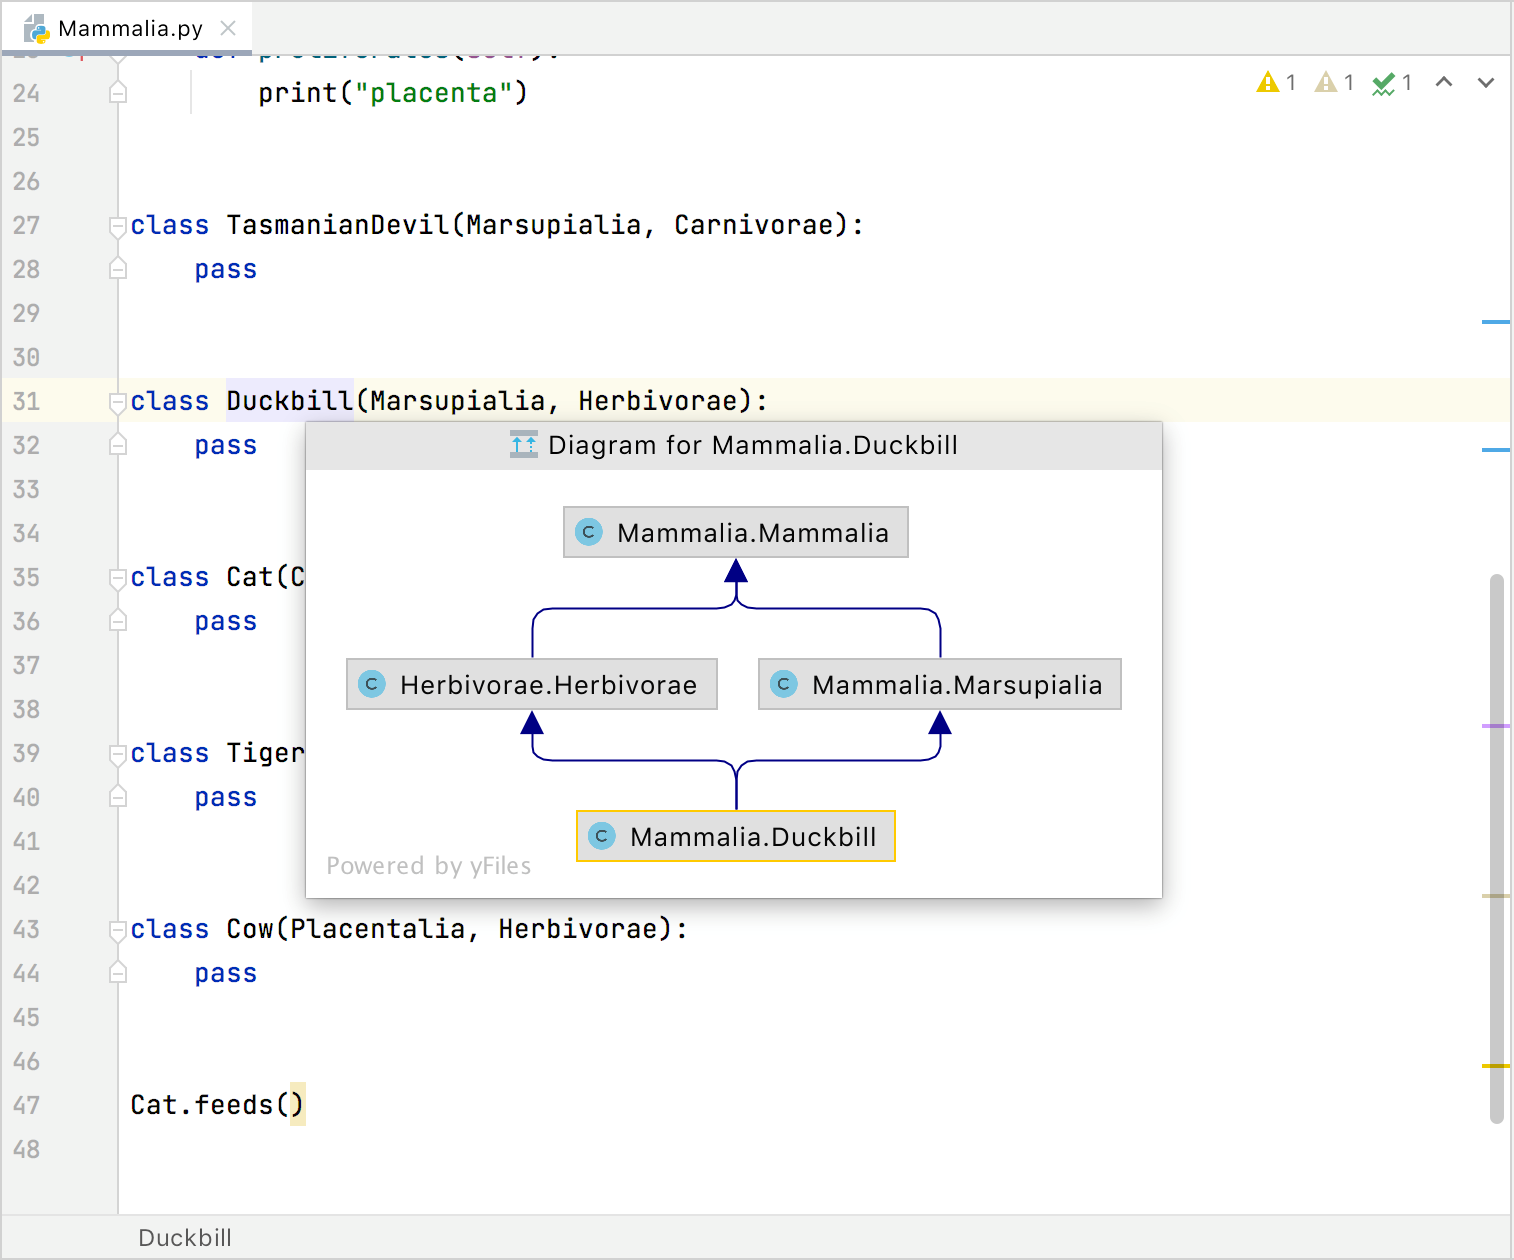
PyCharm lets you generate a diagram on a package in your project. Such diagrams always reflect the structure of actual classes and methods in your application.
View UML class diagram
In the Project tool window, right-click an item for which you want to create a diagram and select Ctrl+Alt+Shift+U).
In the list that opens, select Python Class Diagram. PyCharm generates a UML diagram for classes and their dependencies.
View local changes as a diagram
You can use the UML Class diagram to evaluate how your local code changes affect the application.
From the context menu of the code editor, the Project tool window, or the Changes view, select , or press Ctrl+Alt+Shift+D.
The diagram opens in a popup. You can double-click a node to view changes in a Diff Viewer.
To view changes in revisions as a UML Class diagram, in the History tab of the Version Control tool window, select the desired revision and select Show Diff as UML from the context menu or press Ctrl+Shift+D.
Analyze class diagram
To see the list of methods, fields, and other code elements, select the appropriate icon on the diagram toolbar located on top of the diagram editor.

When you click through classes in the graph, PyCharm greys out classes that do not reside in the same package. This might be helpful, when you generate a diagram on a package that contains inner packages.
To save the diagram as a file, right-click the diagram editor and from the context menu, select and then the file extension in which you want to save the diagram.
Manage class diagram
When working with diagrams, use the context menu in the diagram editor to perform different tasks. You can view members of the class, add new, delete the existing ones, see implementations, check parent classes, perform basic refactoring, add notes, and so on.
You can navigate to the underlying source code by selecting a diagram element and pressing F4).
Select elements in a diagram
To select an element, click it in diagram.
To select multiple adjacent elements, keep Shift pressed and click the desired elements, or just drag a lasso around the elements to be selected.
To select multiple non-adjacent elements, keep Ctrl+Shift pressed and click the desired elements.
To select a class member, double-click the class element, and then use the arrow keys, or the mouse pointer.
Add an existing class to a diagram
Press Space.
In the search field that opens, start typing a name of the class you want to add. Then, select the desired class from the suggestion list.
If you want to add a class that is out of the project scope, select the Include non-project items checkbox.
Delete a node element from the diagram
In the diagram editor, select a node element you want to delete.
Right-click the element and from the context menu, select Delete Delete.
Alternatively, select Alt+Delete. In this case, PyCharm checks for usages before applying the changes.
Add new members to a class
You can perform some forward engineering while in the diagram editor.
In the diagram editor, select a class to which you want to add a new member and from the context menu, select or press Alt+Insert. Then select a code element (a field or a method) you want to create.
Depending on your selection, PyCharm opens the appropriate dialog where you specify the necessary information for creating the new element.
PyCharm adds the item to your diagram and updates the source code accordingly.
View implementations and parent classes
You can view implementations and parent classes in your diagram. If PyCharm finds more than one parent class or implementation, it displays a list of appropriate items. Select the one you need to see the connections between the parent and its children.
In the diagram editor, select an item for which you want to see implementations or parent classes.
Right-click the items and from the context menu, select the Show Implementations Ctrl+Alt+B or Show Parents Ctrl+Alt+P respectively.
In the popup that opens, select items you need and press Enter. To extend your selection up or down while in the popup, press Shift+Up or Shift+Down respectively.
Configure diagram settings
You can configure the diagram settings so that you have certain options available by default when you create a diagram.
Press Ctrl+Alt+S to open the IDE settings and then select .
In the right-hand pane, select the options that you want to see by default and click OK to apply your changes.
Analyze graph
The Analyze Graph action group lets you analyze the graph in various ways such as perform auto clusterization, measure the node centrality, search cycles, filter path between two nodes, and so on.
Filter paths between two nodes
Most of the time, generated diagrams are big and complicated. Typically, you want to concentrate only on the specific part of the diagram. PyCharm lets you filter paths between two diagram elements.
In the diagram editor, select two nodes on which you want to focus and right-click one of them to open the context menu.
From the context menu, select .
In the dialog that opens, select additional options if needed and click Find.
PyCharm displays connections associated only with the selected nodes.
Measure diagram centrality
You can use this action to identify the important nodes in the graph.
In the diagram editor, right-click anywhere in the editor to open the context menu.
From the context menu, select .
In the dialog that opens, select additional options if needed and click Measure.
The node "importance" is expressed via fractional value from 0.0 to 1.0 measurement, and the brightest node selection should be explored first.
Productivity tips
- Enable the diagram preview
Open the Structure tool window Alt+7 and drag the shadow area to obtain the desired view. Select one or more nodes in the diagram to highlight the corresponding nodes in the preview area.
- Manage diagram layout
Right-click the diagram background, and choose from the context menu. Then select the desired layout from the submenu. To apply the selected layout, click
 on the diagram toolbar.
Alternatively, drag entities in the diagram manually to achieve the desired layout.
- Zoom in and out
Use any of the following techniques:
Click
 and
and  on the diagram editor toolbar.
Keeping Ctrl pressed, rotate your mouse wheel.
Press NumPad+ or NumPad-.
- Use the magnifier tool
Keeping Alt pressed, hover over diagram areas.
- View the structure of a database or table as a diagram
In the Database tool window, right-click a schema or a table and select Diagrams | Show Visualization Ctrl+Alt+Shift+U or Ctrl+Alt+U from the context menu.
- View SQL query plan as a diagram
In the editor, right-click an SQL statement and select Explain Plan. Then, in the Output pane, switch to the Plan tab. By default, the query is displayed as a tree. To see it as a diagram, click Show Visualization (
 ) or press Ctrl+Alt+Shift+U.
Toolbar
Item | Description |
|---|---|
| Click this button to show fields in the class nodes. |
| Click this button to show methods in the class nodes. |
| Click this button to show inner classes in the class nodes. |
| Click this button to increase the scale of the diagram, or press NumPad+. |
| Click this button to decrease the scale of the diagram, or press NumPad-. |
| Click this button to restore the actual size of the diagram. |
| Click this button to make the contents fit into the current diagram size. |
| Click this button to apply the current layout, selected from the context menu of the diagram, or press F5. |
| Click this icon to scale the diagram to the edges of the window. |
| Click this icon to copy the diagram into the clipboard. |
| Click this icon and then select any diagram area with the mouse: the selected area will be copied into the clipboard. |
| Click this button to save the current diagram as a UML file. |
| Click this icon to export a diagram using various formats, which are compatible with third-party tools, to a file, to an image, or open the diagram in the browser.  You can select and configure the following options:
|
| Click this button to print the diagram. |
Context menu
The table below contains commands that are not available from the toolbar.
Item | Description |
|---|---|
New | Use this node to add new elements to a diagram. |
Show Categories | Shows or hides categories like methods, inner classes, and fields. |
Add Class to Diagram | Enables adding an existing class to the diagram. Start typing the class name and select the target item from the completion list. |
Delete | Deletes the selected diagram. |
Refactor | This node contains refactoring commands, enabled in the current context. |
Jump to Source | Choose this command to open the selected diagram node element in the editor. |
Find Usages | Choose this command to search for usages of the selected node element. |
Actual Size | Restores the actual size of the diagram |
Fit Content | Fits the content into the current diagram size. |
Layout | Select the desired diagram layout from the submenu. |
Orientation | Provides you with the following orientation options: Bottom to Top, Top to Bottom, |
Apply Current Layout | Applies the current layout, selected from the Layout node of the diagram context menu |
Route Edges | Scales the diagram content to the edges of the diagram window. |
Appearance | Manages the way the diagram is presented by showing the grid, edge labels, bridges. Allows you to merge edges and select edge shapes. |
Snap to grid. | Aligns elements against the grid. |
Fit Content After Layout | Fits the diagram content after selecting the layout. Enabled by default. |
Copy Diagram to Clipboard | Click this icon to copy the diagram into the clipboard. |
| Click this icon and then select any diagram area with the mouse: the selected area will be copied into the clipboard. |
Export to Image File | Saves the diagram in an image file with the specified name and path. The possible formats are: jpeg, png, svg, svgz, or gif. |
Prints the diagram. | |
Save UML Diagram | Saves the current diagram in the specified location as xml file. |
Legend of the Class Diagram
PyCharm follows the UML conventions in showing relationships between the classes.
Besides that, PyCharm supports the following colors and arrows:
Item | Description |
|---|---|
 | The green arrow corresponds to the |
 | The blue arrow corresponds to the class extension. |
 | This sign appears for the inner classes. |