Scientific project tutorial
In this tutorial, you will create a Scientific project to run and debug Python code with data visualization.
Before you start, make sure that conda is installed.
Creating a Scientific project
Create a PyCharm project with the scientific settings predefined
Open the New Project wizard (File | New | Project).
Choose Scientific project type.
In the project settings dialog window, specify a project name, ensure that conda is selected as the new environment, and alter the default data folder (if needed), then click Create.
Open the main.py file and add the following code sample:
import numpy as np import matplotlib.pyplot as plt N = 50 x = np.random.rand(N) y = np.random.rand(N) colors = np.random.rand(N) area = np.pi * (15 * np.random.rand(N))**2 # 0 to 15 point radii plt.scatter(x, y, s=area, c=colors, alpha=0.5) plt.show() X = np.linspace(-np.pi, np.pi, 256,endpoint=True) C,S = np.cos(X), np.sin(X) plt.plot(X, C, color="blue", linewidth=2.5, linestyle="-") plt.plot(X, S, color="red", linewidth=2.5, linestyle="-") plt.xlim(X.min()*1.1, X.max()*1.1) plt.xticks([-np.pi, -np.pi/2, 0, np.pi/2, np.pi], [r'$-\pi$', r'$-\pi/2$', r'$0$', r'$+\pi/2$', r'$+\pi$']) plt.ylim(C.min()*1.1,C.max()*1.1) plt.yticks([-1, 0, +1], [r'$-1$', r'$0$', r'$+1$']) plt.show()Process warnings shown for the
numpyandmatplotlibimports and enable the packages in the project.
Running
Run your scientific project Shift+F10. The code is executed and shows two graphs in the Plots tool window. Clicking the preview thumbnail displays the respective graph:

You can modify the project code to plot only one graph at a time. You can execute fragments of your code by creating code cells.
Execute code cells
Modify the main.py file by adding the "#%%" lines.

In the gutter, click the icon
on the line with the scatter plot cell mark. Only the scatter graph will be built.
Now click the icon
on the line with the y versus x plot cell mark. The corresponding graph should appear.
Debugging
Let's put a breakpoint at the line:
This line appears twice in our example code, and so there will be two breakpoints.
Right-click the editor background and from the context menu choose Debug <project_name>.
You see the Debug tool window and the grey characters in the editor. This is the result of the inline debugging, which is enabled.
The line with the first breakpoint is highlighted. It means that the debugger has stopped at the line with the breakpoint, but has not yet executed it. If we execute this line (for example, by clicking the Step Over on the stepping toolbar of the Debug tool window), we'll see the graph:

Next, look at the Variables tab of the Debug tool window. If you click the View as Array link next to the area array, the Data View tool window opens:

When you process excessive amount of data, you might experience degradation of debugging performance if the debugger loads variable's values synchronously or asynchronously. It is recommended to switch to the On demand mode by selecting the corresponding loading policy. See Managing Variables Loading Policy for more information.
Mind the only column in the table - it's explained by the fact that the area array is one-dimensional.
Running in console
Right-click the editor background and choose the Run File in Console command.
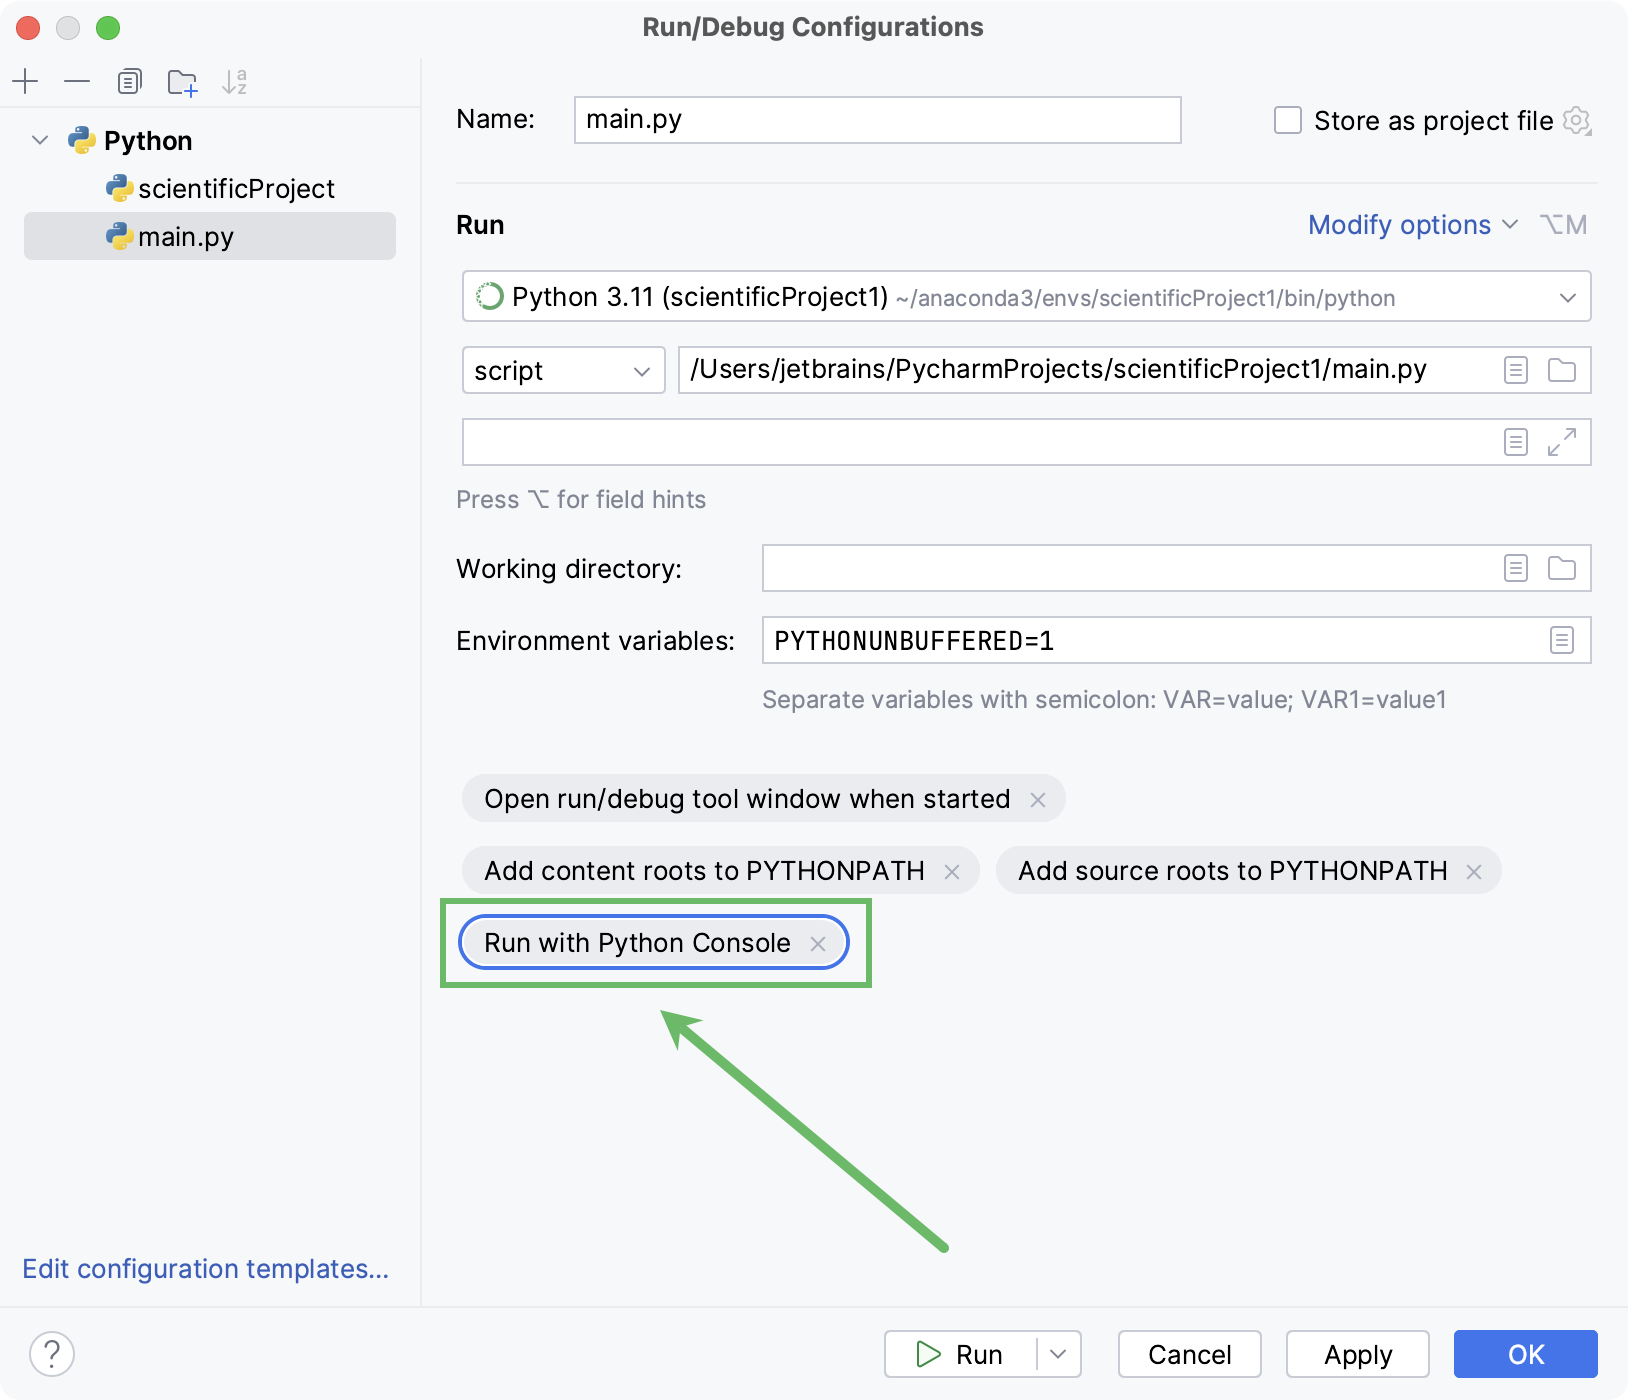
This command corresponds to running a run/debug configuration for the main.py file with the Run with Python console checkbox selected:

When this command is run, the >>> prompt appears after the output in the Run tool window, and you can execute your own commands.
Summary
So, what has been done with the help of PyCharm?
The file main.py was created and opened for editing.
The source code has been entered (note the powerful PyCharm's code completion!)
The source code has been run and debugged.
Finally, we ran the file in console.