Query execution plan
The EXPLAIN command shows the execution plan of a statement. It means you can see details on the approach that the planner took to execute the statement. For example, how the tables are scanned, what join algorithms are used to bring together the required rows, statement execution costs, and other information.
Execution cost is the planner's guess at how long it takes to run the statement. The measurement is made in relative cost units. The execution cost has two options: start-up and total. The start-up cost shows how long it takes before the first row can be processed, while the total cost shows how long it takes to process all the rows.
PyCharm provides the following actions for the EXPLAIN command:
Explain Plan: the statement is only planned.
Explain Analyse: the statement is actually executed, not only planned. In this case, you can see the run time statistics in milliseconds.
These actions are located in the Explain Plan dropdown on the code editor toolbar. You can also invoke them using the code editor context menu.

The result is shown in a mixed tree and table format on a dedicated Query Plan tab. For more information about the Query Plan tab, refer to the Services tool window topic.
Copy a query plan
You can copy the query plan in the database’s native format, for example, JSON or XML.
Right-click an SQL statement, and select
.
Alternatively, click
Explain Plan on the toolbar and select Explain Plan
In the Query Plan tab, click
Copy Original Query Plan at the top of the left toolbar.
This is supported for PostgreSQL, Amazon Redshift, MySQL, MariaDB, Oracle, Microsoft SQL Server, and Snowflake.

Visualize a query plan
Right-click an SQL statement, and select
.
Alternatively, click
Explain Plan on the toolbar and select Explain Plan
By default, the tree representation of the query plan is displayed in the Query Plan tab of the Services tool window. To visualize the query execution plan, click
Show Diagram…, or press Ctrl+Alt+Shift+U.
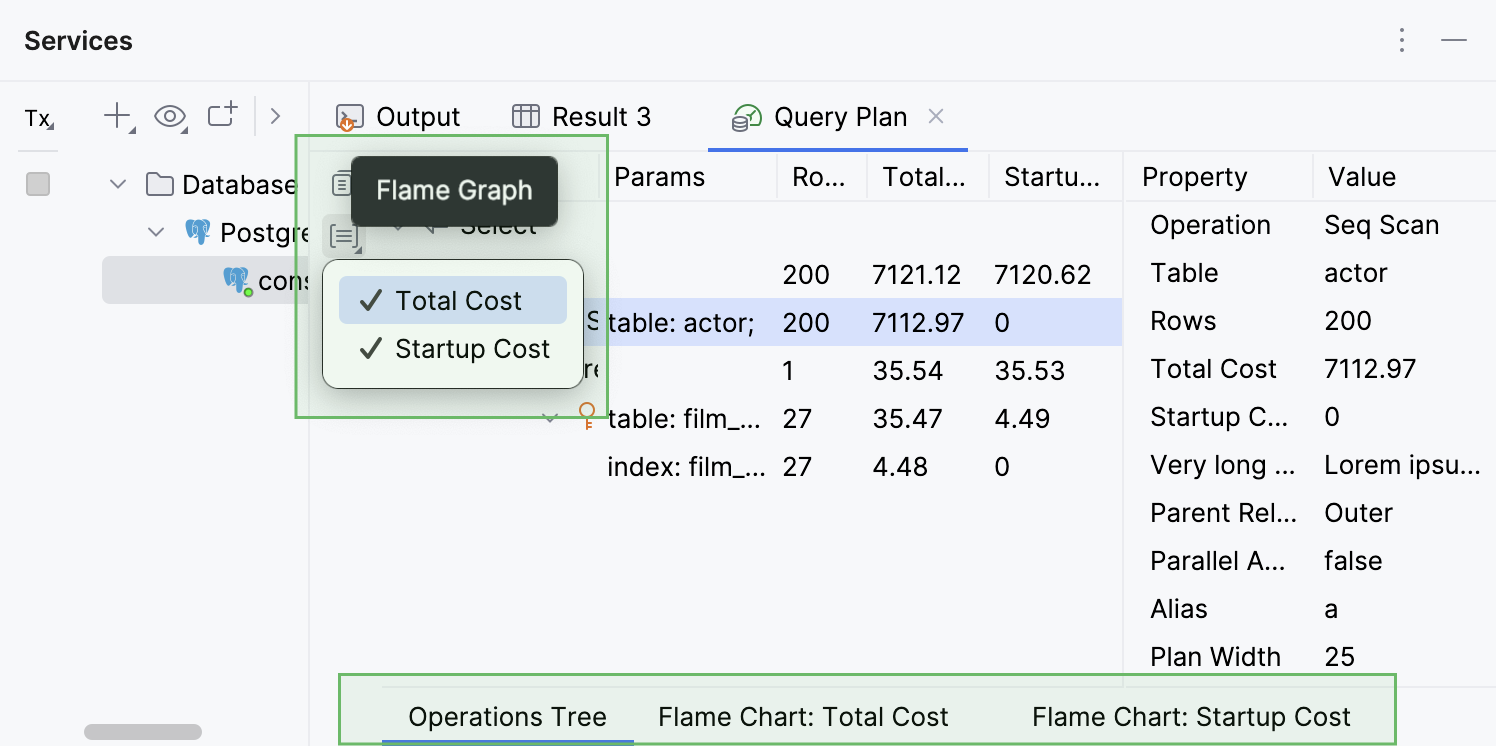
The different views available for a query plan are displayed in separate inner tabs. These inner tabs can be accessed at the bottom of the Query Plan tab. They are hidden by default and appear only when more than one tab is open.
Generate a flame graph for EXPLAIN
Right-click an SQL statement, and select
.
Alternatively, click
Explain Plan on the toolbar and select Explain Plan
By default, the tree representation of the query plan is displayed in the Query Plan tab of the Services tool window. Click
Flame Graph and select between the following options:
Total Cost: how long it takes to return all the rows.
Startup Cost: how long it takes before the first row can be processed.
PyCharm displays the newly opened graph in a separate inner tab, keeping the tree representation in the Operation Tree inner tab.
