Reports
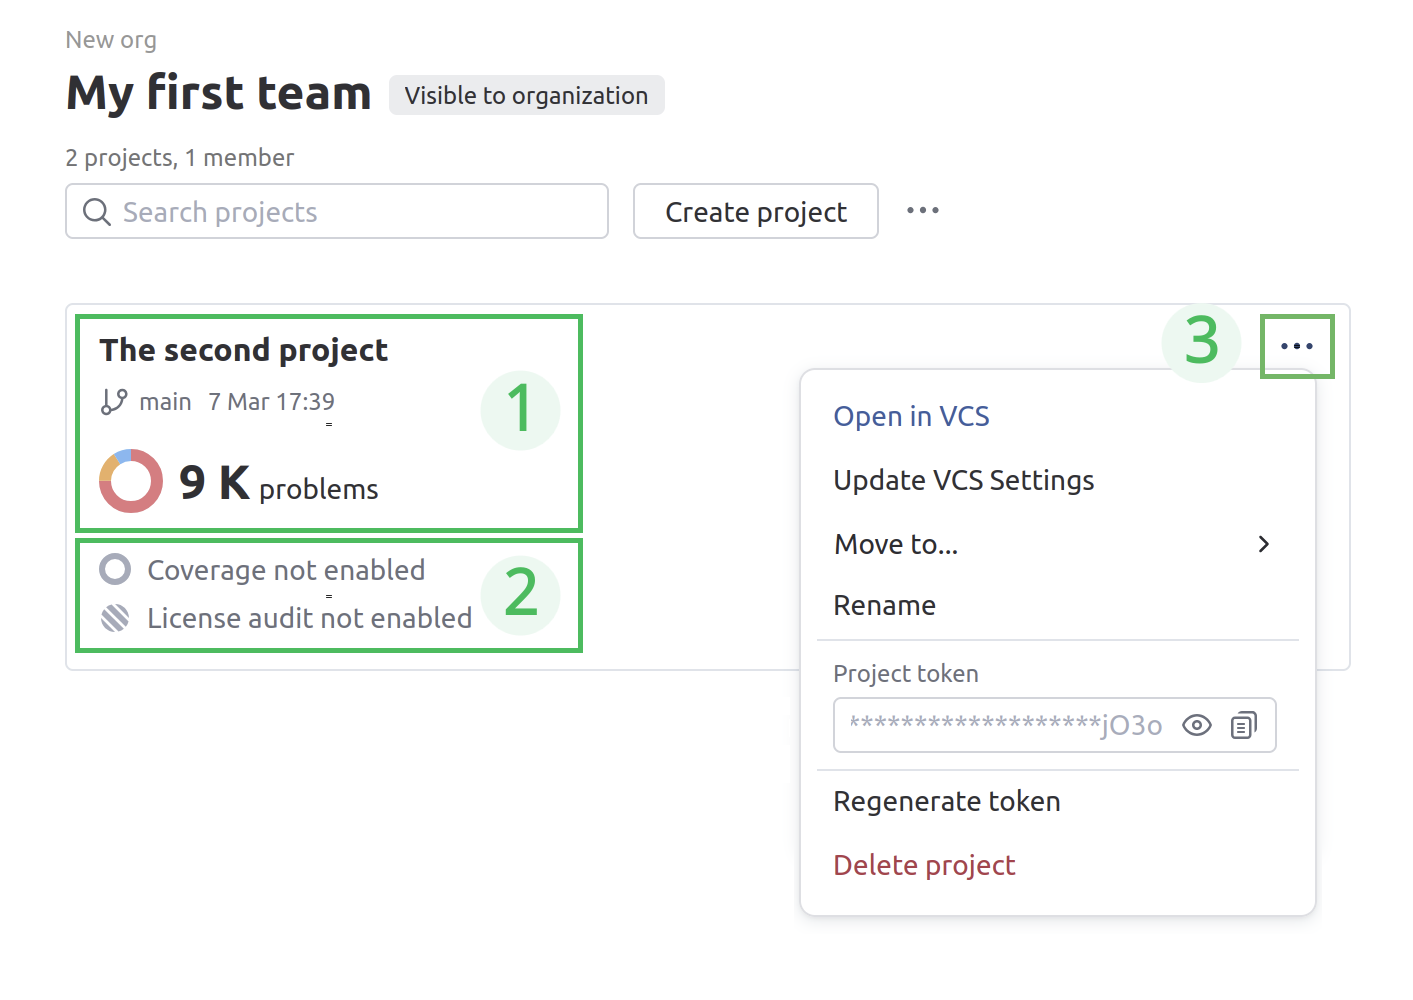
Information from project reports is aggregated and displayed in several sections marked on this image.

Here is the description of each section:
1. The project name, the branch name, time passed since the last analysis, the number of detected problems and their severity.
2. Analysis results using the code coverage and license audit features.
3. The context menu that lets you:
Configure HTTPS or SSH URL of the VCS
Move your project to another team
Rename the project
Copy or regenerate the project token
Delete the project
This table shows how Qodana Cloud interprets and displays several reports depending on their metadata.
Branch name | Commit time | Commit hash | Displays |
|---|---|---|---|
The same | The same | N/A | The latest report and overwrites the previous reports |
The same | Different | N/A | Separate reports |
N/A | N/A | The same | Single report |
To see the project reports, click it. This will open the report page.

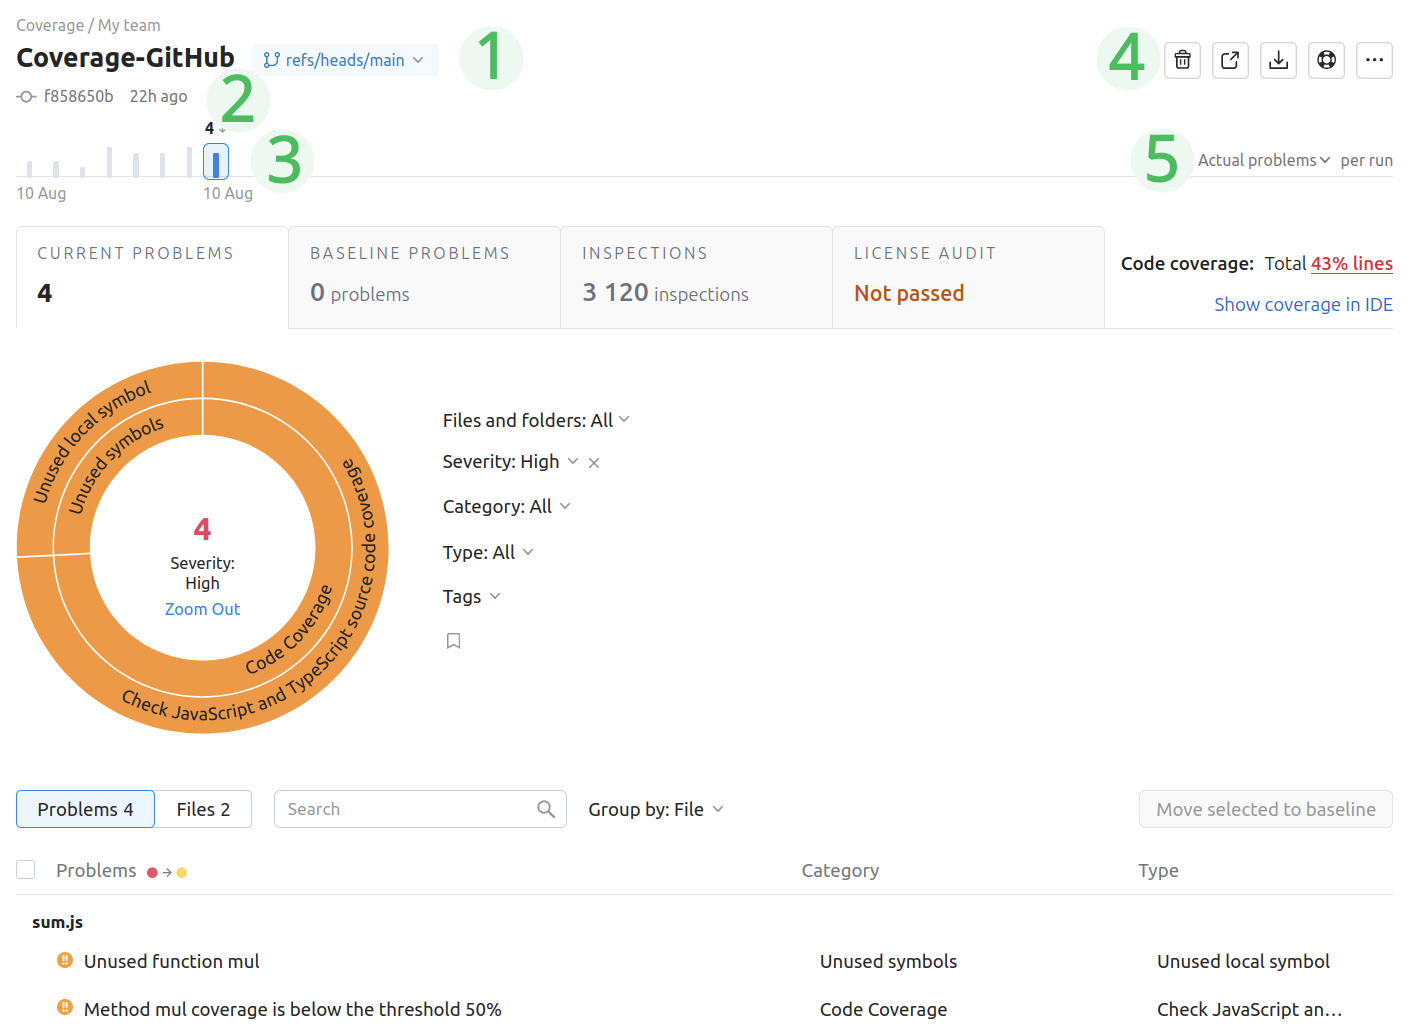
The upper part of the report page contains:
1. Branch selector. Using it, you can view reports for each branch in your project.
2. Commit hash and time of the latest analysis.
3. Timeline describing the date of analysis, number of problems detected.
4. Buttons for navigating to the build page, downloading the report in SARIF format, opening the help guide and configuring the project.
5. Selector for viewing either the absolute number of detected problems or the number of problems relatively to a baseline set for this project.
To learn more about Qodana report UI, see the Analysis reports section.