Analyze code issues in design time
ReSharper starts analyzing a code file as soon as you open it in the editor, all the way you edit it, until it is closed. All detected code issues are highlighted in the editor according to their severity levels. The map of the issues is also displayed on the marker bar in the right part of the editor window, where you can see instantly the status of the file and click the marks to navigate to specific code issues.
Design-time inspection features
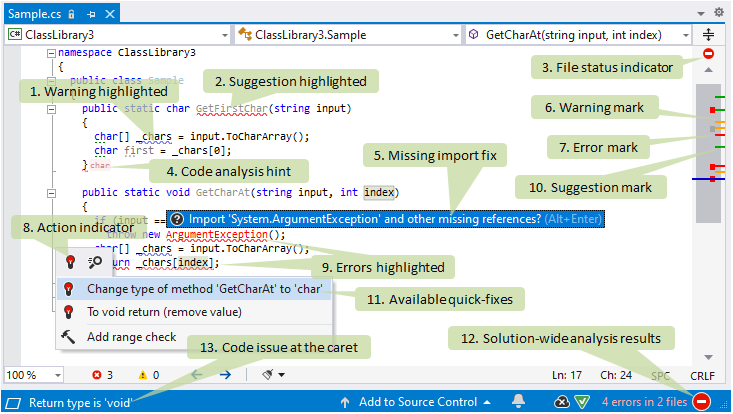
To illustrate the design-time code inspection performed by ReSharper, consider the following code excerpt displayed in the editor:

In this example, we can see the following features of ReSharper code inspection:
A medium-priority code issue (in this case, a warning about a symbol name that does not match the naming style) is highlighted with a curly underline.
A low-priority code issue (in this case, a suggestion related to an unused public member) is greyed out.
Status indicator helps you to quickly see whether the current file has any code issues.
Code analysis hints make missing function returns, missing breaks in switch statements, and disposed resources easier to notice.
A fix popup that appears for non-imported types. Simply press Alt+Enter or click this popup to have ReSharper add the missing directive for all types in the file. For more information, refer to Import missing namespaces.
A marker corresponding to a warning is displayed on the marker bar.
A marker corresponding to an error is displayed on the marker bar.
Action indicator that appears to the left of the caret position if ReSharper has anything to suggest there.
High-priority code issues (in this case, errors related to an unresolved symbol and an incorrect return type) are highlighted with red text and a red curly underline.
A marker corresponding to a suggestion is displayed on the marker bar.
The action list, which can be opened by pressing Alt+Enter or clicking the action indicator, contains a list of quick-fixes for the issue at the caret.
If solution-wide analysis is enabled, ReSharper allows you to see even more code issues. In this example, it detects the unused public member and notifies you of errors in other files in your solution. Click the solution-wide analysis icon to explore the detected issues.
A short description of the issue at the caret appears in the status bar.
View problem description
For each code issue, ReSharper provides a short description that you can view in several ways:
When the caret is at the highlighted code, check the bottom left corner of the status bar.

When the caret is at the highlighted code, press Ctrl+K, I to view the problem description in a tooltip. Alternatively, hover over any highlighted code.

Hover over code issue markers on the marker bar.

Navigate code issues
If the design-time code inspection is enabled, you can easily navigate between all issues (except those with the hint severity level) detected in the current file.
Navigate code issues in the current file
Press F12 to go to the next code issue, or Shift+F12 to go to the previous code issue.
From the main menu, choose or .
Use the marker bar on the right side of the editor window: clicking the markers brings the caret to the corresponding issues; clicking the status indicator on top of the marker bar brings the caret to the next issue in the file.
Right-click the status indicator and choose Go to Next/Previous Error/Warning/Suggestion — these commands will help you navigate between code issues of the highest severity level. So if there are errors, they only navigate between errors, as soon as all errors are fixed they navigate between warnings, and so on.
Navigate errors in file or solution
Press Alt+F12 to go to the next error, or Shift+Alt+F12 to go to the previous error.
From the main menu, choose or .
If the Solution-wide analysis is enabled and there are some errors, the number of errors is displayed in the right corner of the status bar. You can click this number to go to the next error in the solution.
When is design-time inspection disabled?
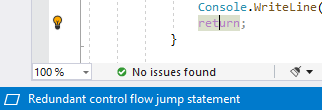
By default, design-time code inspection is enabled in all supported languages, but there are several situations where the analysis may not be available in the current file. You can recognize files where code inspection is disabled by the pause icon ![]() on the status indicator.
on the status indicator.
- Design-time inspection is disabled globally
You can re-enable it by selecting Enable code analysis on the page of ReSharper options Alt+R, O.
- Code inspection is disabled in the current file
The current file is excluded from code analysis: it is listed explicitly, by its containing folder, or by the file mask in the Elements to skip section on the page of ReSharper options Alt+R, O.
You can press Control+Alt+Shift+D8 to toggle code analysis for the current file; this will also add it to or remove it from the Elements to skip list.
- Design-time code inspection is disabled because the file is too large
To optimize performance and memory consumption, ReSharper automatically disables design-time inspection in files that are larger than
300kilobytes. You can press Control+Alt+Shift+D8 in each of such files to enable code analysis.- File is not analyzed because it is not included in the solution
ReSharper needs to have a solution model to analyze symbols and references used in each file. Therefore, it cannot analyze files that are not included in the current solution .
This often happens with decompiled files and files from symbol servers that open as you navigate compiled code. You normally don't want to analyze such files because there is no way to make meaningful edits to them.
If, on the other hand, you have opened a file for editing by drag-n-dropping it from the system file manager or via , then you either need to open the solution where the file belongs or include the file in the current solution (right-click a target project and choose ).
- An internal error occurred when analyzing the file
In some rare cases, there might be internal errors that prevent ReSharper from analyzing a file. In such cases, clean the analysis indexes and restart the IDE: click Clear caches on the page of ReSharper options Alt+R, O.
- Code inspection is partly disabled
If the file is listed explicitly, by its containing folder, or by the file mask as containing generated code, design-time code inspection will only report syntax and compiler errors in that file.
Inspection options menu
Besides suggested fixes, for each configurable code inspection as well as for custom inspections, ReSharper shows the Inspection [name of inspection] ![]() sub-menu in the actions list, with the following items:
sub-menu in the actions list, with the following items:
For the most controversial issues, there is the Why is ReSharper suggesting this? item that opens a help page with detailed description of the corresponding inspection.
![Inspection [name of inspection] sub-menu Inspection [name of inspection] sub-menu](https://resources.jetbrains.com/help/img/dotnet/2025.3/code_inspection_menu.png)
Find similar issues
You can not only fix a highlighted issue with a quick-fix, but also find and investigate all similar issues (all issues detected with the same code inspection) in the whole solution or smaller scope.
Find similar issues
Place the caret at a highlighted issue in the editor.
Press Alt+Enter or click the action indicator to the left of the caret to open the action list.
To find similar issues in the current file, choose Inspection [name of inspection] | Find similar issues in [filename] file.
To find similar issues in the current project or solution, expand the submenu and choose the desired scope:

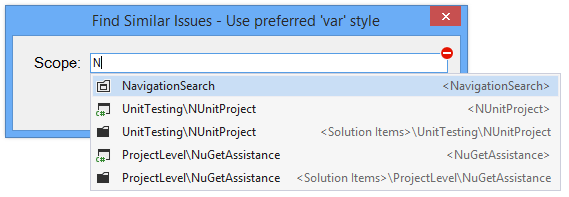
If necessary, you can search for similar issues in any project or solution folder within your solution. To do so, choose Find similar issues in custom scope in the submenu.
In the dialog that opens, type the name of the desired project or solution folder, and then click OK.

All found issues will be displayed in the Inspection Results window.
Integration with Visual Studio code inspection controls
Starting from version 2015, Visual Studio comes with its own code analysis engine (Roslyn) and provides its own quick actions feature to perform refactoring and fixing errors.
Visual Studio's quick actions often perform the same fixes as ReSharper's quick-fixes, context action, or refactorings. Therefore, for some errors you may have two similar suggestions from Visual Studio and from ReSharper. In the illustration below, you can see two bulbs both suggesting to remove redundant using directives:

To avoid this, ReSharper provides the Quick Actions indicator on the left editor margin selector on the page of ReSharper options Alt+R, O.
If necessary, you can also disable Visual Studio's error highlighting in the editor, so that only code issues found by ReSharper are highlighted. To do so, select Hide Visual Studio squiggles on the page of ReSharper options.