Debugging Assistance
With ReSharper, you can improve your debugging experience in the editor.
Inline values
When you suspend execution while debugging your C#, VB.NET, or C++ code, you can see the values of local variables, current line expressions, and function returns right in the editor, next to the corresponding code lines.
This feature provides immediate feedback during debugging sessions, which means that often you don’t even have to consult the Watches or Autos tool windows.
Inline values are enabled by default, but you can configure, which kinds of values should be displayed using the page of ReSharper options.
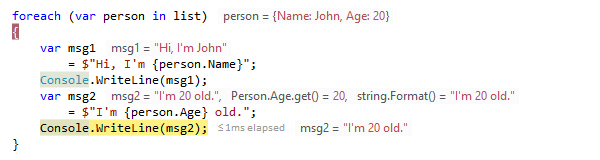
ReSharper understands the [DebuggerDisplayAttribute], which means that values of types, properties, and fields marked with this attribute will be displayed accordingly in the editor adornments.
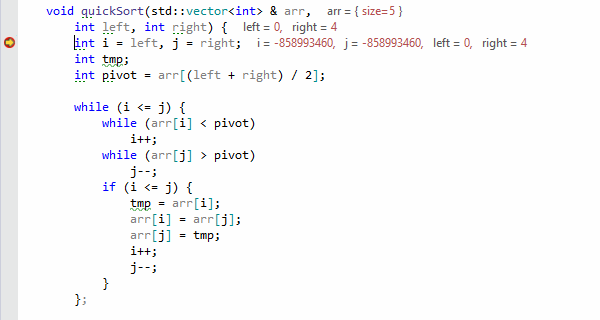
ReSharper is careful to evaluate only those expressions that do not have side effects. At the moment, expression evaluation is limited to references, constants, member access, and built-in subscript operators. Subscript operators of std::vector and std::array are also evaluated as an exception.
Please note that ReSharper calculates inline values using the Visual Studio debugger engine to evaluate expressions, which means that Natvis files with user-provided visualization rules are automatically supported.
Searchable DataTips
ReSharper can optionally replace the Visual Studio DataTips with its own DataTips, which have a number of distinctions:
- You can search for specific values in the current suspended-execution context. To do so, just start typing when the focus is in the DataTip. Note that the search will only find values in expanded nodes.
- The DataTip disappears not when you remove the mouse pointer, but when you click anywhere outside the DataTip.
- If a type neither has a meaningful
ToString()override nor is it annotated with the[DebuggerDisplay]attribute, then the presentation of objects of this type in debugger views could be quite uninformative. In ReSharper DataTips, you can customize presentation of such objects on-the-fly. To do so, expand the type in the DataTip, right-click on the desired data members and choose Highlight Property: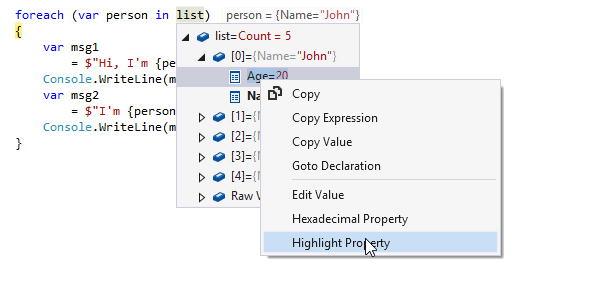
To use ReSharper DataTips instead of Visual Studio DataTips, enable the corresponding option on the the page of ReSharper options.
This feature is supported in the following languages and technologies:
| | | | | | | | | | | | | | | |
|---|---|---|---|---|---|---|---|---|---|---|---|---|---|---|
| | | | | | | | | | | | | | | |
The instructions and examples given here address the use of the feature in C#. For details specific to other languages, see corresponding topics in the ReSharper by Language section.