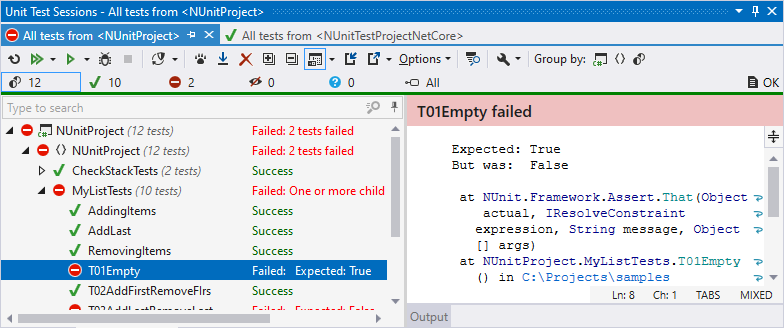
Unit Test Sessions window
ReSharper runs unit tests in the Unit Test Sessions window. The window appears automatically when you run tests from the current document or from the project or solution. For more information, refer to Unit test sessions.

The window is designed to help you run any number of unit test sessions, simultaneously and independently of each other. Sessions can be composed of any combination of tests. In the debugging mode, only one session can be run at a time.
The unit test tree shows the structure of tests belonging to a session, which you can filter to show only passed, failed or ignored unit tests. You can navigate to the code of any unit test by double-clicking it.
Status bar and progress bar
The progress bar and the status bar under the toolbar display the current progress.
On the status bar, you can see the total number of tests in the session as well as number of tests in different states:
![]()
By default, tests in all states are shown, but you can click the corresponding icons to filter tests by their state. You can also Ctrl-click several icons to display tests in several different states.
Control | Name | Description |
|---|---|---|
| All Tests | Show all tests in the current test session. |
| Passed Tests | Only show successful tests and hide all other tests. |
| Failed Tests | Only show failed tests and hide all other tests. |
| Ignored Tests | Only show ignored tests and hide all other tests. A test is ignored if it has the corresponding attribute, or if the whole category where it belongs is ignored. |
| Unknown Tests | Only show tests that either were not executed or have changed since the last execution. |
| Execution log | Lets you see either the number of test execution errors (related to the execution process, not tests themselves) or shows OK if there are no errors. You can click this icon to show or hide the execution log. |
Window tabs
When unit test sessions open in the window, they are displayed in new tabs, which show up on the left. The previously open tabs move to the right if the width of the window allows, otherwise they unload themselves saving memory - but you can always restore them by clicking the arrow that appears to the right of the tabs and clicking the required tab:

To prevent a tab from unloading, click the pin icon ![]() next to the tab title.
next to the tab title.
Toolbar Controls
Control | Name | Description | ||||||||||||
|---|---|---|---|---|---|---|---|---|---|---|---|---|---|---|
| Repeat Previous Run Control+T T | Repeats the previous test run. | ||||||||||||
| Run Current Session Control+T Y | Runs all tests in the tree. You can use the integrated drop-down selector for other actions
| ||||||||||||
| Run Unit Tests Control+T R | Runs selected tests. To select multiple tests, click them holding the Ctrl key. You can use the integrated drop-down selector for other actions on the selected tests:
| ||||||||||||
| Debug Unit Tests Control+T D | Starts debugging for selected tests in the current session. | ||||||||||||
| Stop Execution | Stops the current test session. | ||||||||||||
| Autostart Tests: Run All Tests | Enables continuous testing for the current unit test session. All tests in the session will be automatically run on explicit user action: build or save (selected in continuous testing settings). | ||||||||||||
| Autostart Tests: Run New and Outdated Tests | Enables continuous testing for the current unit test session. Only new and outdated tests in the session will be automatically run on explicit user action: build or save (selected in continuous testing settings). | ||||||||||||
| Autostart Tests: Cover New and Outdated Tests | Enables continuous testing for the current unit test session. New and outdated tests in the session will be automatically run with enabled coverage analysis on explicit user action: build or save (selected in continuous testing settings). | ||||||||||||
| Track Running Test | If this button is on, the selection in the list of tests is switched automatically to the test that is currently executing. | ||||||||||||
| Auto Scroll Output When Running Test | This button enables the output pane to scroll when the test is running so that the end of the output is always visible. | ||||||||||||
| Remove Selected Tests Delete | Removes selected tests from the current session. | ||||||||||||
| Export Session | Click to save the current test session in a .testsession file. | ||||||||||||
| Import Session | Click to open a test session that you have previously saved in a .testsession file. | ||||||||||||
| Expand All/Collapse All | Expands/collapses all nodes in the current tab. | ||||||||||||
| Show Output Ctrl+P | This selector allows you to open the Output and the Coverage panes and place them to the bottom or to the right of the window. The Output pane lets you analyze test results and navigate from a failed test's output to the code lines that originated the assertion or exception, all with a single click. The Coverage pane displays the code coverage tree and appears if JetBrains dotCover is integrated with ReSharper. | ||||||||||||
Options | You can configure this set of preferences individually for each test session.
| |||||||||||||
| Show Stack Trace in a new Window Ctrl+Shift+Alt+E | Opens the output of the currently selected test in a new tab of the Stack Trace Explorer window. | ||||||||||||
| Reference dotMemory Unit Framework | Installs the dotMemory Unit Testing Framework NuGet package and references it in the unit test project where the selected test belongs. This button appears if JetBrains dotMemory is integrated with Visual Studio. |