Explore Project Dependency Diagram
ReSharper_ShowProjectDependencyGraph
With ReSharper, you can explore project dependencies in your solution having a visual presentation of the solution architecture. At any moment, you can get a project dependency snapshot for your solution and study it. Note that the project dependency snapshot is not updated when you change dependencies between projects — to refresh the dependency view, you have to take another snapshot.
The Architecture View allows visually exploring project dependency snapshots and comparing the current state of the solution to snapshots taken earlier.

Get project dependency snapshot
A project dependency snapshot is a record of all projects in your solution and all dependencies between them, taken at a specific moment in time. With ReSharper, you can take and save such snapshots. Later, you can load and compare a saved snapshot to the current state of the solution. The visual representation of the dependency snapshots is provided in the Architecture View.
For large solutions, building the dependency diagram and calculating code metrics can take some time. However, the analysis is performed asynchronously and without building the solution. So you can continue working with code while the diagram is being build.
In the Solution Explorer, select one or several projects, one or several solution folders, or the solution node.
Right-click the selection and choose Show Project Dependency Diagram or choose in the main menu.
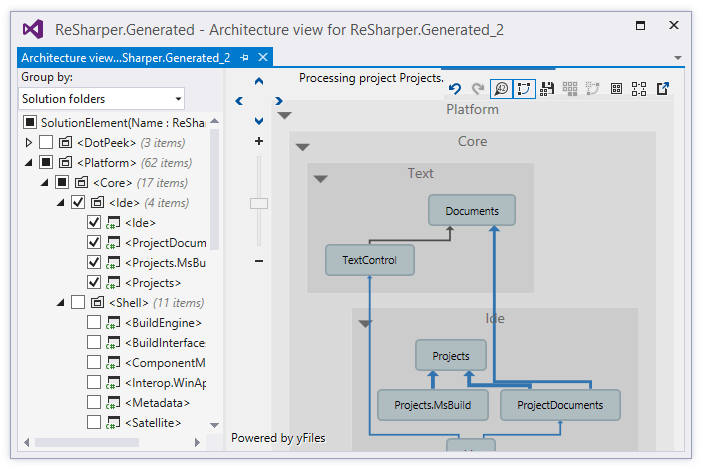
The Architecture View opens in a new document tab showing dependencies for the items that you selected initially.
The initially selected items are also checked in the left part of the Architecture View, which lists all solution items. You can check other items: they will appear in the diagram and the corresponding links will be added.
- If necessary, you can change grouping of items using the Group by selector in the toolbar:
None - all projects are displayed without grouping.
Solution Folders - projects are grouped by solution folders.
File Structure - projects and solution folders are grouped by the file system structure.
Understand links between projects
When you get a dependency snapshot, ReSharper makes it in two steps:
Build the dependency diagram based on the project references. This step is done very quickly even in large solutions.
Perform the coupling analysis to calculate numbers of usages in the referencing project. This step can take several minutes and it runs in the background. The progress of the analysis is reflected by the status bar on top of the Architecture View.
The state of the coupling analysis, which is enabled by default, corresponds to the state of the Turn Coupling Analysis on/off
 button. The coupling analysis is a resource-intensive process and may affect performance on large solutions. If you experience any lags when working with the diagram, you can use this button to disable the coupling analysis, adjust the diagram as needed, and then enable the analysis again. The analysis algorithm first calculates the coupling of the displayed projects and then processes projects hidden from the view.
Links between projects in the diagram can be displayed in the following ways:
| Line style | Meaning |
|---|---|
| Black solid line | The coupling analysis is either in progress or disabled, so the number of usages for this reference is unknown. |
| Blue solid line of specific width | The coupling analysis is over for this reference and at least one usage exists in the referencing project. The line thickness represents how many times types of the referenced project are used in the referencing project. If you hover the mouse over a reference, this number appears in the tooltip. |
| Black dotted line | The coupling analysis is over for this reference and the reference is unused. You can right-click it and choose to remove it. |
| Green dotted line | The two projects are linked through other referenced projects that are currently hidden from the view. |
| Green solid line | The reference is missing in the snapshot but it exists in the solution. Can only appear if the Show Diff |
| Red solid line | The reference exists in the snapshot but is missing in the solution. Can only appear if the Show Diff |
Show and hide items
You can show or hide specific solution items (projects, folders, solution folders) in the diagram using check-boxes for the corresponding items in the left. There are also several ways to show/hide items right from the diagram area:
To select some items in the diagram and hide others, Ctrl-click items you want to select, then right-click the selection and choose Selection | Show only selected modules.
To select two linked items, right-click the link between them and choose Selection | Show only selected modules.
To hide an item, you can select it in the diagram and press Delete.
Another way to concentrate on specific items is to display the dependent or referenced projects and hide all other items. To do so, select one or more items (projects or grouping items), right-click the selection and choose Show This/These and Dependent/Referenced. Note that these commands only hide the irrelevant items and do not add any referenced/dependent nodes, which are currently hidden.
To display all items referenced by or dependent on the specific projects, even if these items are currently hidden from the view, select one or more items and choose Selection | Add referenced/dependent modules.
If necessary, you can reverse changes made in the diagram (shown/hidden projects) step by step by clicking Undo ![]() or pressing Ctrl+Z. To reverse the Undo commands, click Redo
or pressing Ctrl+Z. To reverse the Undo commands, click Redo ![]() or press Ctrl+Y.
or press Ctrl+Y.
Pan and zoom the diagram
To pan and zoom the diagram, use the controls in the upper left corner of the diagram area. Alternatively, you can pan the diagram using scroll bars or click anywhere in the diagram area outside the diagram items and drag while the hand cursor ![]() is shown. You can also use the mouse wheel for zooming.
is shown. You can also use the mouse wheel for zooming.
Rearrange items on the diagram
The diagram layout is calculated automatically, but you can change it if necessary: all items can be moved. To move an item, first click it to select, and then click and drag it while the cross cursor ![]() is shown.
is shown.
Group projects on the diagram
Using the Group by selector, you can group projects by solution folders or by file system structure. The grouping applies both in the left part and in the diagram.
If necessary, you can collapse and expand grouping items in the diagram in one of the following ways:
Click the down arrow in the left top corner of the grouping item. When collapsed, the sign changes into an up arrow and you can click it to expand the item.
Select a grouping item in the diagram and press Ctrl + Left Arrow and Ctrl + Right Arrow.
Click Collapse Graph
 and Expand Graph
  on the toolbar to collapse or expand all grouping items.
Analyze project references
To learn more about the usages, select the corresponding link and press Alt+F7 or right-click and choose Show Usages. ReSharper will show the usages in the Find Results window.
If the coupling analysis is over for a specific reference and ReSharper highlights it as unused (with a dotted line), you do not need to switch from the diagram to remove the unused reference - just select it and press Control+Shift+R or right-click and choose Refactor This. Then press Alt+Delete or click Safe Delete Assembly Reference.
Detect possible architecture problems
If you are trying to follow the best practices in solution architecture, your application probably has the layered structure with separate layers that communicate with each other.
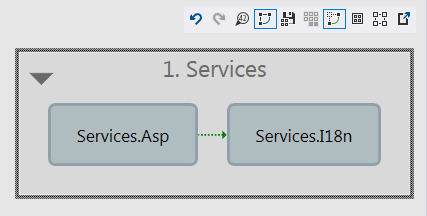
The Show possible paths ![]() button allows you to find out whether the application layers are designed correctly, not only in terms of grouping, but also in terms of communications between the layers. In short, when the button is on, you can see whether two specific projects have a path between them consisting of other referenced projects that are currently hidden from the view. These paths are shown in green dotted lines. The button is only enabled if there are hidden intermediary projects that would link any two of the currently displayed projects.
button allows you to find out whether the application layers are designed correctly, not only in terms of grouping, but also in terms of communications between the layers. In short, when the button is on, you can see whether two specific projects have a path between them consisting of other referenced projects that are currently hidden from the view. These paths are shown in green dotted lines. The button is only enabled if there are hidden intermediary projects that would link any two of the currently displayed projects.
To illustrate the way it works, consider the following example:
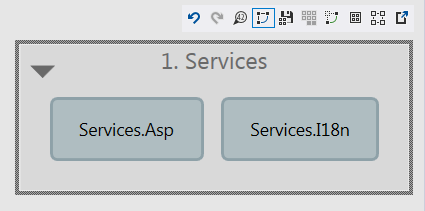
Imagine that we have a large solution and are now analyzing the 'Services' architecture layer which is represented by the corresponding solution folder. We show the two projects that we are interested in, others are hidden:

The two projects do not have direct project references between them, however, if we enable the Show possible paths
 button, we'll see that there is a path between these projects through other projects:
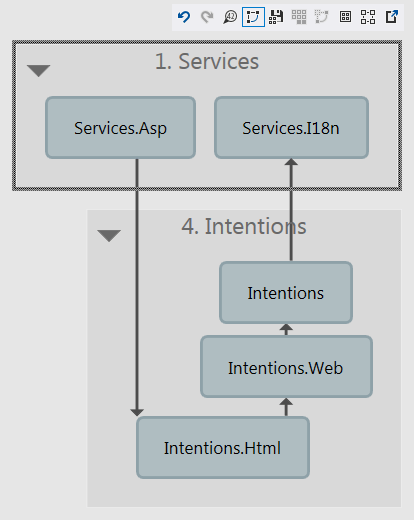
To see how these two projects can depend on each other, we right-right on the path link and choose Show path. The intermediary projects appear on the diagram, and we can see that they all are in another layer:

Based on this information, we can see that the application structure may need to be reworked.
Export the diagram to a file
At any point of exploring dependencies, you can use the following toolbar buttons to export the diagram to a file:
Export to PNG
 to export the current view of the diagram to a PNG image.
 Export to GraphML
 to export the diagram in the GraphML format for external analysis.
 Export to XPS
 to export the diagram in the XPS format if you need to print a large diagram.
Compare saved snapshots to the current solution state
If the dependency snapshot shown in the Architecture View differs from the current solution state, the Show Diff ![]() button becomes available.
button becomes available.
If you want to record the current state of the solution, you can save the snapshot to a file. To do so, click Save Architecture Graph ![]() on the toolbar and then choose where to save the snapshot file.
on the toolbar and then choose where to save the snapshot file.
You can load and study the saved snapshot later by choosing in the main menu. If the snapshot was saved with the same solution as the current one, you will be able to see differences between the current state of the solution and the state saved in the snapshot.