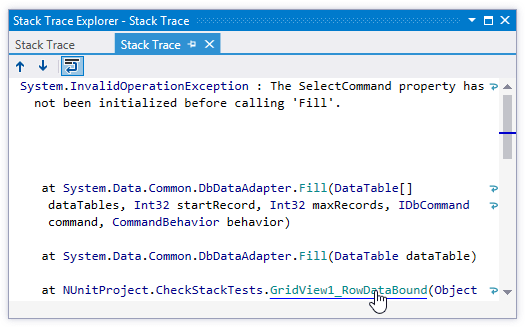
Explore and navigate exception stack traces
When you receive an external stack trace (for example, from a bug report), you can open it in the dedicated Stack Trace Explorer window and then navigate to code where the corresponding exception originated. In this window, you can click files, types, and methods to display them in the editor.
Each stack trace is opened in a new tab, which stays available until you close it or close the solution. If you close the Stack Trace Explorer window, you can reopen it by choosing from the menu.
Navigate to code that caused an exception
Copy exception stack trace to the clipboard.
By default, if you copy a stack trace that contains symbols from the currently opened solution and then switch focus to Visual Studio, ReSharper will automatically load it to the Stack Trace Explorer window and bring it to the view. If you do not like this behavior, clear the Auto open external Stack Traces checkbox on the page of ReSharper options (Alt+R, O). If auto-opening is disabled, use the shortcut or menu command as described below.
Press Control+Shift+E or choose from the main menu.
The Stack Trace Explorer window opens displaying the exception stack trace from the clipboard in a new tab.
Study the stack trace and click highlighted items to open the corresponding code in the editor.
If you prefer to wrap long lines in the stack trace, use the corresponding toolbar button
.png) or specify the default preference for line wrapping on the page of ReSharper options (Alt+R, O).
or specify the default preference for line wrapping on the page of ReSharper options (Alt+R, O).
