Analyze search results
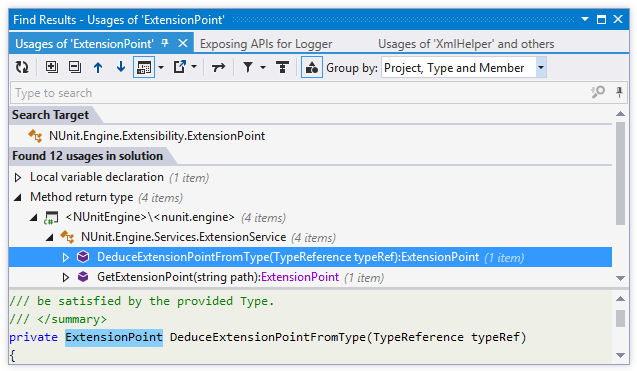
If any of the ReSharper's navigation and search actions produces multiple results, these results can be displayed in the Find Results window, which provides a lot of ways to analyze the search results.
You can change the default behavior so that even the single found usage is also displayed in the Find Results window. To do so, clear the Go to Usage: if there is only one result.... checkbox on the page of ReSharper options ( Alt+R, O ).
Some actions, for example Find Usages automatically display the results in this window. For other actions, you can do it manually when a popup with the search results is displayed — click Show in Find Results ![]() , press Shift+Enter or + on the numeric keypad .
, press Shift+Enter or + on the numeric keypad .
Results of each new navigation or search action are displayed in a new tab of the Find Results window, so you can easily get back to previous searches.
If you close the Find Results window, you can always reopen it by choosing in the main menu or by pressing Control+Alt+U. Tabs with search results are preserved until you close the solution.
Find Results window

Window tabs
When search results open in the window, they are displayed in new tabs, which show up on the left. The previously open tabs move to the right if the width of the window allows, otherwise they unload themselves saving memory - but you can always restore them by clicking the arrow that appears to the right of the tabs and clicking the required tab:

To prevent a tab from unloading, click the pin icon ![]() next to the tab title.
next to the tab title.
Find Results window toolbar controls
Depending on the type of search results, the set of toolbar controls may vary.
Control | Name | Description |
|---|---|---|
| Refresh | Updates window content to reflect any changes made in the code or externally. |
| Expand All/Collapse All | Expands/collapses all nodes in the current tab. |
| Previous/Next Shift+F8 / F8 | Navigate to the previous/next item and scrolls through the source code accordingly. |
| Show Preview Ctrl+P | Hides or shows the pane with a preview of the selected item in the position specified using the list (at the bottom or in the right part of the window). |
| Export | Click this button to export the data currently displayed in the window in text format , or use the drop-down selector to export the data in an XML or HTML format. The Export Data dialog that appears will help you save the data to a file or copy it to the clipboard . |
| Merge Occurrences on the Same Line | When this option is selected, occurrences on the same line are shown as a single item. |
| Show Only Read Usages | When this option is selected, only read usages are displayed. Available for usages of fields, properties and local variables. |
| Show Only Write Usages | When this option is selected, only write usages are displayed. Available for usages of fields, properties, and local variables. |
| Filter Usages | With this list, you can select specific kinds of usages to display - for example, declaration, invocation, parameter, method return, and so on. Click Show All Usages to enable all kinds of usages or Clear Filters to disable all kinds of usages thus hiding all usages in the current tab. |
| Show on Diagram | Click this button to display all the types shown in the window in the type dependencies diagram view. |
| Toggle grouping by kind | Use this button to group search results by kind of usage - that is, how exactly the target item is used at different places — for example, declaration, invocation, parameter, method return, and so on. You can further refine grouping inside 'kind' groups using the Group by selector. You can also use the Filter Usages |
Group by | Allows grouping items in the window by different categories. |
View code related to a search result
To open a specific result in the editor, double-click it or press Enter or Ctrl+Enter. There is a difference between these two shortcuts: Enter opens the corresponding line in the editor but keeps the focus in the Find Results window so that you can press Up and Down to study other results; Ctrl+Enter also moves the focus to the editor.
If you want results to open in the Preview tab, select the Open preview tab for selected item in Find Results window option on the page of ReSharper options ( Alt+R, O ).
To open the next/previous search result in the editor, press F8 / Shift+F8.
To study the source code of the selected item right in the window, click Show Preview ![]() on the toolbar. If necessary, you can locate the preview pane at the bottom or on the right.
on the toolbar. If necessary, you can locate the preview pane at the bottom or on the right.
Filter search results
To filter search results by name, just start typing the part of the name in the window.
Search results of most navigation and search commands can be further filtered by the kind of occurrence.
To show only read or write usages, click
.png) or
or .png) on the toolbar.
on the toolbar.Click Filter Usages
.png) and choose which kinds of occurrences should be displayed.
and choose which kinds of occurrences should be displayed.To clear the filtering, click Filter Usages
.png) and choose Show all usages.
and choose Show all usages.To hide some occurrences, select one or more items or grouping nodes, and press Delete or right-click and choose Ignore. Selected occurrences will be hidden from the current results view. You can use the Show Ignored Usages
.png) button on the toolbar to show or hide ignored items, which are displayed in grey. To stop ignoring items, select them and press Insert or right-click and choose Undo Ignore.
button on the toolbar to show or hide ignored items, which are displayed in grey. To stop ignoring items, select them and press Insert or right-click and choose Undo Ignore.
Group search results
Search results are shown as a tree view, which can be displayed in various hierarchical orders. The default order depends on the initial search, but you can always change it with the Group by selector on the toolbar.
To make the results tree always expand automatically after the search, select Expand search results tree by default on the page of ReSharper options ( Alt+R, O ).
By default, all results are shown as separate items. Sometimes it can be convenient to display all results found in the same line as a single item. To do so, click Merge Occurrences on the Same Line ![]() on the toolbar.
on the toolbar.
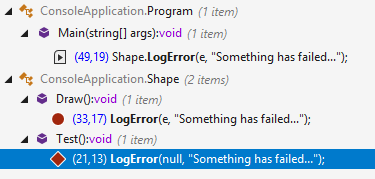
You can also group search results by kind of usage - that is, how exactly the target item is used at different places — for example, declaration, invocation, parameter, method return, and so on. To do so, click Toggle grouping by kind ![]() on the toolbar.
on the toolbar.
If you want to display results as a plain list, select None in the Group by selector.
Set breakpoints and tracepoints
Independently of how you get the results in the Find Results window, you will see breakpoints and tracepoints if lines where they are set appear in the search results. Moreover, you can toggle breakpoints with F9, enable/disable breakpoints with Ctrl+F9, or access commands related to breakpoints and tracepoints from the context menu.

Other actions with search results
If the search results are related to each other (that is, if they are usages of a specific symbol, symbols derived from a specific symbol, and so on), you can display them in the type dependency diagram by clicking Show on Diagram ![]() on the toolbar.
on the toolbar.
If any symbol or a grouping node is not the target of the usages search in the current tab, you can find usages of this symbol or find usages of related symbols right from the Find Results window. To do so, right-click this item and choose the corresponding action in the context menu, or alternatively, press Alt+F7 or Shift+Alt+F7.