Debugger Basics
In this section:
Debug
After you have configured a run configuration for your project, you can launch it in debug mode by pressing F5.
In the Debug tool window you can see the list of frames and threads with their states, variables and watches. When you select a frame, you see the variables corresponding to the selected frame.
Useful debugger shortcuts
- Toggle breakpoint: F9
- Resume program: F5
- Step over: F10
- Step into: F11
- Stop: Shift+F5
- View breakpoint details/all breakpoints: Alt+F9
- Debug code at caret F5 (e.g if you stay within the main method), or Shift+Alt+F9
Breakpoints
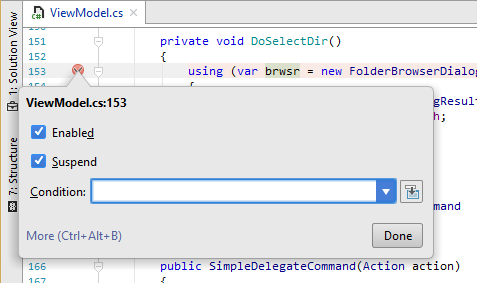
Breakpoint details and condition
If you want to change details of a breakpoint, press Alt+F9. Here you can specify the breakpoint conditions.

To see all breakpoints in the project (with more advanced settings), press Ctrl+Alt+B.
Action breakpoints
Another action might be useful if you want to evaluate something at a particular line of code without actually making a stop. You can do that by using the Action breakpoint. To create one, just click on the gutter while holding Shift.
Temporary breakpoints
To create a breakpoint that stops only once, click the left gutter while holding Shift+Alt.
Refer to the section Types of Breakpoints for details.
Disable breakpoints
It's also useful to know that any breakpoint can be quickly disabled by clicking on the gutter while holding Alt.
Refer to the section Enabling, Disabling and Removing Breakpoints for details.
Debugger session
Run to cursor
Sometimes you need to resume the program and stop at another line of code, without adding another breakpoint. Easy: just press Ctrl+F10.
Evaluate expression
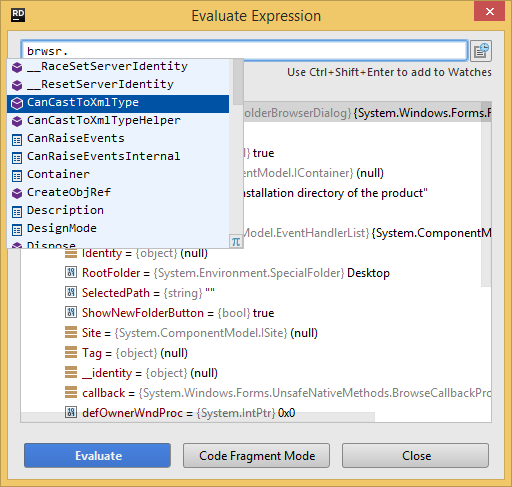
While in debug mode, you can evaluate any expression by pressing Alt+F8.
This tool provides code completion just as in the editor so it’s very easy to enter any expression:

Refer to the section Evaluating Expressions for details.
Settings
If you want to change the default debugger settings, go to Rider settings (Ctrl+Alt+S) and use pages under .