Executing Tests and Analyzing Results
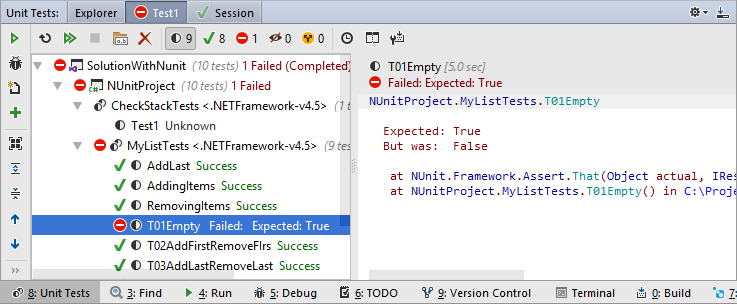
JetBrains Rider provides several ways to execute unit tests. Whichever way you choose, execution progress, results, and output are displayed in session tabs of the Unit Tests window.
Different ways of running and debugging unit tests
There are following ways to run or debug unit tests:
- Use one of the ways to execute tests in the current document.
- Use one of the ways to execute tests in the project/solution.
- If there are existing unit test sessions, you can run or debug some or all tests in a session:
- Select tests that you want to execute in the session tab of the Unit Tests window and click Run Unit Tests
 / Debug Unit Tests
  on the toolbar or press Ctrl+U, R / Ctrl+U, D.
 - To run all tests in the session, click Run All Tests
 on the toolbar or alternatively, choose in the main menu or press Ctrl+U, Y.
- Select tests that you want to execute in the session tab of the Unit Tests window and click Run Unit Tests
As tests are running in a unit test session, the Stop Execution ![]() button becomes active. You can click this button to abort execution of the tests. You can run multiple unit test sessions simultaneously. However, when you debug tests, only one test session can be executed at a time.
button becomes active. You can click this button to abort execution of the tests. You can run multiple unit test sessions simultaneously. However, when you debug tests, only one test session can be executed at a time.
If necessary, you can always re-run the tests that you executed last by pressing Ctrl+U, U or choosing in the menu.
Run configurations for test sessions
JetBrains Rider automatically creates a new run configuration for each test session. The created run configuration stays synchronized with the corresponding session until you remove the session.
Analysing execution results and output
When the execution is over, the results are visualized in the Unit Tests window.

The output pane (which you can place on the right or on the bottom using the Toggle output position ![]() button on the toolbar) displays output of the selected test. If the test is failed, JetBrains Rider also adds short information on the failure and/or displays the stack trace of an exception. You can use clickable links in the output pane to navigate directly to types and methods involved with the failure.
button on the toolbar) displays output of the selected test. If the test is failed, JetBrains Rider also adds short information on the failure and/or displays the stack trace of an exception. You can use clickable links in the output pane to navigate directly to types and methods involved with the failure.
By default, JetBrains Rider wraps long lines in the output according to the current width of the output area. If necessary, you choose not to wrap long lines by clearing the Wrap long lines in Unit Test Session output check-box on the page of JetBrains Rider settings (Ctrl+Alt+S).
On the status bar, you can see the total number of tests in the session as well as number of tests in different states: 
-
 — the unit test is currently executing.
 -
 — the unit test is scheduled for execution in the current run.
 -
 — the unit test was not executed.
 -
 — the unit test passed in the lats test run.
 -
 — the unit test failed in the lats test run.
 -
 — the unit test was ignored in the last test run.
 -
 — the unit test was aborted in the last test run.
 -
 — the unit test was started but JetBrains Rider could not read the the test runner output. This could be a sign of an error occurring in the test runner.
The same icons are used to display status of grouping items (classes, projects, etc.)
The icons are also used on each session's tab to display the overall execution result of the sessions.