Monitoring Errors/Warnings in Solution
Ctrl+Alt+2
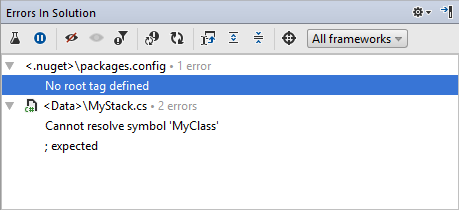
While the solution-wide analysis is enabled, you can use the status bar indicator to monitor errors in solution and you can get a detailed report on all errors in your solution in the Errors in Solution window.
To view the list of errors found in solution
- Enable solution-wide analysis.
- Do any of the following:
- Choose in the main menu.
- Click the circle indicator in the right corner of the status bar and choose Errors in Solution from the drop-down list.
Either way, the Errors in Solution window opens where you can view the list of detected errors and navigate to the related code by double-clicking the entries:

Even without opening this window, you can still easily navigate through errors in your solution with Shift+Alt+Page Down/ Shift+Alt+Page Up, or just by clicking the number of errors to the left of the status bar indicator.
If JetBrains Rider cannot locate a file where errors were found, its entry in the Errors in Solution dialog is marked with a yellow cautionary triangle, as in the Solution Explorer.
If necessary, you can configure solution-wide analysis or ignore specific errors .