Debugging Exceptions with Exception Breakpoints
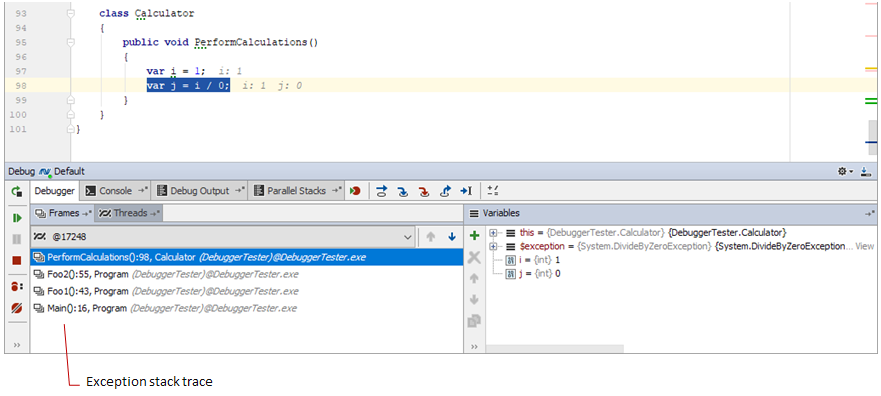
Exception is an error that occurs in runtime and typically breaks normal execution flow. JetBrains Rider allows you to effectively debug application exceptions: you can explicitly tell the debugger to suspend the program execution when an exception of a particular type is thrown. JetBrains Rider stops the execution right after the exception occurs (before any exception handling is run) allowing you to examine program stack frames.
To debug an exception, you should create a special exception breakpoint. Unlike line breakpoints, exception breakpoints are assigned not to a certain line of code but to a certain exception type (e.g., in case of C#, it can be any exception inherited from the Exception type).
To add an exception breakpoint
- Do one of the following:
- Choose from the main menu.
- In the Breakpoints dialog (Ctrl+Alt+B or ), click
 and select .NET Exception Breakpoints in case of C# or JavaScript Exception Breakpoints in case you debug a script written in JavaScript.
- In the opened dialog, enter the desired exception type name and click OK. The breakpoint is added to the list of breakpoints under .NET Exception Breakpoints or JavaScript Exception Breakpoints in the Breakpoints window.

- Specify breakpoint properties. Note that if Just my code is enabled, the debugger will suspend the program only in case the exception is thrown by the user code.
Now, once the exception of the specified type is thrown, the debugger suspends execution. 