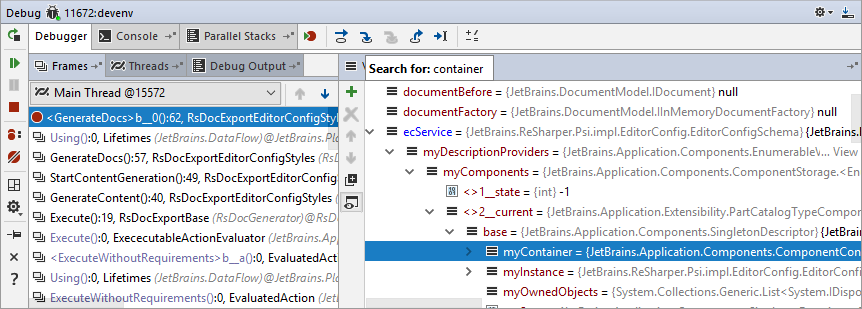
Debug window
Alt+5
Overview
This tool window becomes available when you start debugging.
It displays the output generated by the debugging session for your application. If you are debugging multiple applications, the output for each application is displayed in a separate tab named after the corresponding run/debug configuration.
For each application, there are the following nested tabs:
- Console: displays system information and error messages, and the console input and output of your application.
- Debugger: this tab is divided into the following areas:
- Elements: appears if you are using Chrome browser for debugging.
- Debug Output: shows messages sent by your application to the debug output, e.g. with the
Debug.WriteLine()method. - Parallel Stacks: shows threads and their stack frames on the diagram.
Each area has a context menu that allows you to configure its behavior and navigate between tabs.
Each of the tabs and areas can be hidden/restored, or moved to a location of your choice.

Debug toolbar
| Item | Tooltip and Shortcut | Description |
|---|---|---|
| | Rerun Ctrl+Shift+F5 | Click this button to stop the current application and run it again. |
| | Resume Program F5 | When an application is paused, click this button to resume program execution. |
| | Pause Program Ctrl+Pause | Click this button to pause program execution. |
| | Stop Shift+F5 | Click this button to terminate the current process. Clicking the button once invokes soft kill allowing the application to catch the |
| | View Breakpoints Ctrl+Alt+B | Click this button to open the Breakpoints dialog box where you can configure breakpoints behavior. |
| | Mute Breakpoints | Use this button to toggle breakpoints status. You can temporarily mute all the breakpoints in a project to execute the program without stopping at breakpoints. |
| | Restore Layout | Click this button abandon changes to the current layout and return to the default state. |
| | Settings | Click this button to open the menu with the following options available:
|
| | Pin | Click this button to pin or unpin the currently selected tab. |
| | Close Ctrl+Shift+F4 | Click this button to close the selected tab. |
| | Help F1 | Click this button to open the corresponding help page. |
Stepping toolbar
| Item | Tooltip and Shortcut | Description |
|---|---|---|
| | Show Execution Point Alt+NumPad * | Click this button to highlight the current execution point in the editor and show the corresponding stack frame in the Frames pane. |
| | Step Over F10 | Click this button to execute the program until the next line in the current method or file, skipping the methods referenced at the current execution point (if any). If the current line is the last one in the method, execution steps to the line executed right after this method. |
| | Step Into F11 | Click this button to have the debugger step into the method called at the current execution point. |
| | Force Step Over Shift+Alt+F8 | Click this button to have the debugger step over the method even if this method has breakpoints inside. |
| | Step Out Shift+F11 | Click this button to have the debugger step out of the current method, to the line executed right after it. |
| | Run to Cursor Ctrl+F10 | Click this button to resume program execution and pause until the execution point reaches the line at the current cursor location in the editor. No breakpoint is required. Actually, there is a temporary breakpoint set for the current line at the caret, which is removed once program execution is paused. Thus, if the caret is positioned at the line which has already been executed, the program will be just resumed for further execution, because there is no way to roll back to previous breakpoints. This action is especially useful when you have stepped deep into the methods sequence and need to step out of several methods at once. If there are breakpoints set for the lines that should be executed before bringing you to the specified line, the debugger will pause at the first encountered breakpoint. |
| | Evaluate Expression Alt+F8 | Click this button to evaluate expressions. |
Moving tabs and areas
If you are unhappy with the default layout of the Debug tool window, you can always move the tabs and areas. To to that, just drag a tab or an area to the desired location. The possible target gets highlighted.
Drop the tab or area in the highlighted location.
To restore the default layout of tabs and area, click ![]() in the Debug toolbar.
in the Debug toolbar.