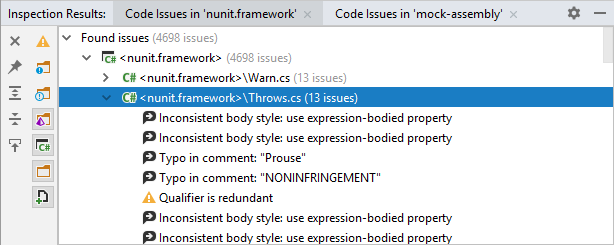
Inspection Results window
Alt+3
This tool window displays code issues when you run code inspection in specific scope.
All code issues displayed in this window have icons that indicate their severity level:
 - Error
  - Warning
  - Suggestion
  - Hint

Toolbar Controls
Control | Name | Description |
|---|---|---|
| Pin Tab | Click this button to pin or unpin the current tab. You may need to pin a tab to prevent it from closing automatically when the maximum number of tabs is reached in this window. |
| Expand All/ Collapse All | Expands/collapses all nodes in the current tab. |
| Autoscroll to Source | When this button is pressed, JetBrains Rider will locate the items you select in the window in their source views: projects and folders — in the Solution Explorer; files — in the editor. |
Title bar context menu and buttons
You can right-click on the window title bar and use the context menu to configure its viewing mode, associate the window with a different tool window bar, or resize and hide the window.
You can also use the toolbar buttons:
Item | Shortcut | Description |
|---|---|---|
| Click this button to access a subset of the context menu commands that let you configure window's viewing mode. | |
| Shift+Escape | Use this icon or shortcut to hide the tool window. When used in combination with the Alt key, clicking this icon hides all the tool windows attached to the same tool window bar. |