Profiling Any .NET Process
dotTrace allows you to profile any .NET process that is already running in the system. The profiling workflow looks like follows:
Step 1. Configuring a profiling session

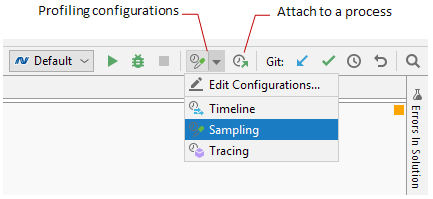
Before starting a profiling session, you must select a profiling configuration:
The profiling configuration specifies which profiling type will be used and whether child processes of a main profiled process (a profiling target) must be profiled.
The profiling target is a running .NET process you're going to attach to.
The Tracing and Line-by-Line profiling types are not available when attaching to a process. If such a profiling configuration is selected, you won't be able to attach to and profile processes.
To select a profiling configuration
-
In the toolbar, in the list of profiling configurations, select:
either one of the predefined configurations: Sampling or Timeline,
or your own custom configuration.
To create a profiling configuration
In the toolbar, in the list of profiling configurations, select Edit Configurations….
In the opened Profiling Configurations window, click
 to add a new profiling configuration.
 -
Specify configuration Name and other profiling options:
- Profiling type
Profiling Method
Profiling Type
Description
Use Case
Performance Profiling
Detailed timing information about function calls.Sampling
Accurate time measurement, number of calls is not measured.
Recommended for most cases. Ideal when you look for performance issues in your app for the first time.
Tracing*
Accurate calls number measurement, time measurement may be inaccurate due to profiling overhead.
When sampling data is not enough. For example, for analyzing algorithm complexity (when info about number of calls is more valuable than call time values).
Line-by-line*
Each line of code is measured, call time values are inaccurate due to huge profiler overhead.
For advanced use cases only. For example, when you already know what function causes issues and want to analyze each line of it.
Timeline Profiling
Detailed temporal data about application threads and events.Timeline
Collects temporal data about thread states, application events, and other multi-threading data. Based on Event Tracing for Windows (ETW).
Recommended for most cases. Especially, for analyzing multithreaded apps. Use it, for example, to determine the cause of UI freezes, excessive garbage collections, uneven workload distribution, insufficient I/O, and so on.
Profile child processes: If selected, dotTrace will profile not only the main app process but the processes it runs as well.
Record profiling data from start: If selected, dotTrace will start collecting profiling data right after the launch. Otherwise, dotTrace will start collecting the data only after you click Start Recording in the Performance Profiler tool window.
- Profiling type
Step 2. Running the session and getting snapshots
To start a session and get snapshots
In the main menu, select or click the corresponding button
 on the toolbar. This will open a list of running processes.
 -
Select the process you want to profile (note that this must be a managed .NET process).
Once the profiling is started, you will see the Performance Profiler tool window opened on the Profiling tab with the profiling controller inside.
If you disabled Record profiling data from start in the profiling configuration, click
 Start Recording to start recording profiling data.
Basically, now all you need is reproduce the performance issue you are looking for or, if you just evaluate the overall app performance, go through the desired usage scenarios in your application.Click
 Get Snapshot. The collected snapshot will be added to the list of snapshots inside the Performance Profiler window. To start collecting profiling data again, click
  Start Recording one more time.
Step 3. Analyzing collected snapshots
For more details on how to analyze performance snapshots, please refer to Analyzing Profiling Results.
To analyze a snapshot
On the All Snapshots tab of the Performance Profiler tool window, select the snapshot you want to analyze.
-
Analyze the collected data using one of the views:
Call Tree: a "classic" call tree that shows you all method calls in all threads. Each top-level node represents a top-level function which was executed by a certain thread. Use this view to quickly get down to actual application activity. Learn more
Top Methods: the best place to start when analyzing application performance. It is a simple plain list of methods with the highest execution time. Note that you can reduce the system functions "noise" by excluding them from the list using the
 toggle: if enabled, method's execution time is calculated as a sum of method's own time and the time of all child system methods (down to the next user method in the stack). Learn more
Once the suspicious method is found, press F4 or select Jump to Source from the context menu. Rider will navigate you right to the method's source code.