Profiling Unit Tests
Along with applications, dotTrace allows you to profile unit tests. The profiling workflow looks like follows:
Step 1. Configuring a profiling session

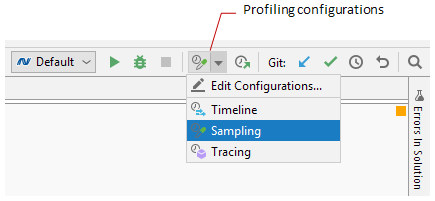
Before starting a profiling session, you must select a profiling configuration:
The profiling configuration specifies which profiling type will be used and whether child processes of a main profiled process (a profiling target) must be profiled.
The profiling target is a unit test runner that runs selected tests.
To select a profiling configuration
-
In the toolbar, in the list of profiling configurations, select:
either one of the predefined configurations: Sampling or Timeline,
or your own custom configuration.
To create a profiling configuration
In the toolbar, in the list of profiling configurations, select Edit Configurations….
In the opened Profiling Configurations window, click
 to add a new profiling configuration.
 -
Specify configuration Name and other profiling options:
Profiling type
Profile child processes: If selected, dotTrace will profile not only the main app process but the processes it runs as well.
Record profiling data from start: This setting is ignored when profiling unit tests.
Step 2. Running the session and getting snapshots
To start a session and get snapshots
-
Do one of the following:
Open the Unit Tests window, select unit tests you want to profile, and click the
 Profile Unit Tests button or select in the main menu.
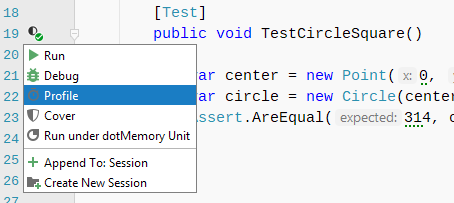
 In the code editor, open the menu in the left gutter for a desired unit test or test class and select Profile.

Once the profiling is started, you will see the Performance Profiler tool window opened on the Profiling tab with the profiling controller inside.
When profiling unit tests, you don't have to manually control the profiling session (get snapshots and finish the session). dotTrace will automatically take a performance snapshot once a unit test session is over. The collected snapshot will be added to the list of snapshots inside the Performance Profiler window.
Step 3. Analyzing collected snapshots
For more details on how to analyze performance snapshots, please refer to Analyzing Profiling Results.
To analyze a snapshot
On the All Snapshots tab of the Performance Profiler tool window, select the snapshot you want to analyze.
-
Analyze the collected data using one of the views:
Call Tree: a "classic" call tree that shows you all method calls in all threads. Each top-level node represents a top-level function which was executed by a certain thread. Use this view to quickly get down to actual application activity. Learn more
Top Methods: the best place to start when analyzing application performance. It is a simple plain list of methods with the highest execution time. Note that you can reduce the system functions "noise" by excluding them from the list using the
 toggle: if enabled, method's execution time is calculated as a sum of method's own time and the time of all child system methods (down to the next user method in the stack). Learn more
Once the suspicious method is found, press F4 or select Jump to Source from the context menu. Rider will navigate you right to the method's source code.