Unit Tests window
Alt+8
This window lets you manage all your unit testing activities in different tabs.
To search tests, start typing a test name or its CamelHumps abbreviation as soon as your focus is in this window.
Explorer tab
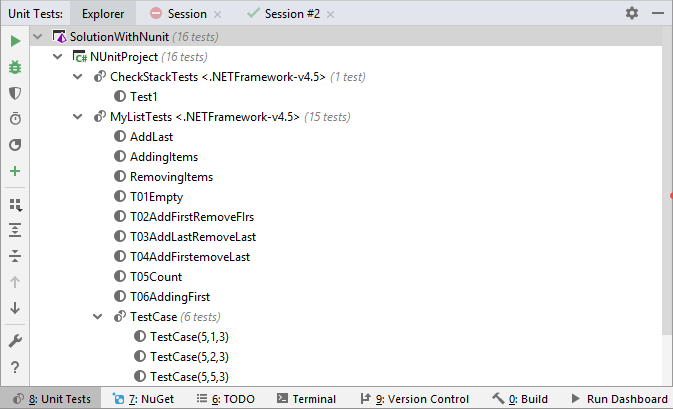
Using this tab, you can explore and run/debug unit tests of all supported frameworks in the entire solution. Note that unit tests from a project only appear in the tab after the project is built. Tests from currently opened files are updated automatically, new tests from the opened files appear in the unit test explorer as soon as you create them.

When the Explorer tab, or any unit test session tab is open, you can use the following controls on the left-hand toolbar:
Toolbar Controls
Control | Name | Description |
|---|---|---|
| Run Unit Tests Ctrl+U, R | Runs selected tests. To select multiple texts, click them holding the Ctrl key. |
| Debug Unit Tests Ctrl+U, D | Debugs selected tests in the current session. |
| Cover Unit Tests | By clicking this button, you can start code coverage of the selected tests. |
| Profile Unit Tests | By clicking this button, you can profile selected tests. |
| Run Unit Tests under dotMemory Unit Ctrl+U, M | Runs selected tests tests with dotMemory Unit enabled. Use this button to run tests that use dotMemory Unit framework check code for memory issues. |
| Append Tests to Session Ctrl+U, A | Click this button to add the selected tests to a test session. JetBrains Rider will suggest choosing one of the existing sessions or creating a new one. |
| Grouping | Allows grouping items in the window by different categories. |
| Expand All/ Collapse All | Expands/collapses all nodes in the current tab. |
| Previous/ Next | Navigate to the previous/next item and scrolls through the source code accordingly. |
| Unit Test Settings | Opens the page of JetBrains Rider settings, where you can configure all settings related to unit testing. |
Unit test sessions tabs
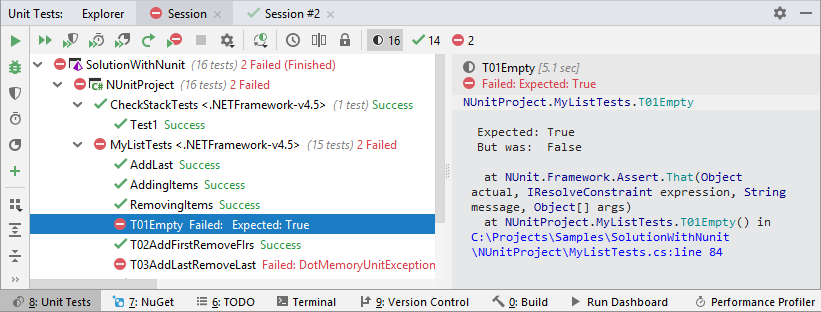
These tabs appear each time you run tests from the current document or from the project or solution. For every new combination of tests (unit test session), a new tab opens.
These tabs are designed to help you run any number of unit test sessions, simultaneously and independently of each other. Sessions can be composed of any combination of tests. In the debugging mode, only one session can be run at a time.
The unit test tree shows the structure of tests belonging to a session, which you can filter to show only passed, failed or ignored unit tests. You can navigate to the code of any unit test by double-clicking it.

When a unit test session tab is open, you can additionally use the following controls on the upper toolbar:
Toolbar Controls
Control | Name | Description |
|---|---|---|
| Repeat Previous Run Ctrl+U, U | Repeats the previous test run. |
| Rerun Failed Tests Ctrl+U, F | Starts execution of tests that failed in the previous run. |
| Run Current Session Ctrl+U, Y | Runs all tests in the current session. |
| Run Unit Tests Ctrl+U, R | Runs selected tests. To select multiple texts, click them holding the Ctrl key. |
| Stop Execution | Stops the current test session. |
| All Tests | Show all tests in the current test session. |
| Passed Tests | Only show successful tests and hide all other tests. |
| Failed Tests | Only show failed tests and hide all other tests. |
| Ignored Tests | Only show ignored tests and hide all other tests. A test is ignored if it has the corresponding attribute, or if the whole category where it belongs is ignored. |
| Inconclusive Tests | Only show inconclusive tests. A test is considered inconclusive if it was started but JetBrains Rider could not read the test runner output. This could be a sign of an error occurring in the test runner. |
| Show Time | Allows you to show or hide execution time for each item. |
| Toggle Output Position | Use this button to change the position (right or bottom) of the output pane, which lets you analyze test results and navigate from a failed test's output to the code lines that originated the assertion or exception. |
| Options | You can configure this set of preferences individually for each test session.
|
Title bar context menu and buttons
You can right-click on the window title bar and use the context menu to configure its viewing mode, associate the window with a different tool window bar, or resize and hide the window.
You can also use the toolbar buttons:
Item | Shortcut | Description |
|---|---|---|
| Click this button to access a subset of the context menu commands that let you configure window's viewing mode. | |
| Shift+Escape | Use this icon or shortcut to hide the tool window. When used in combination with the Alt key, clicking this icon hides all the tool windows attached to the same tool window bar. |