Start Debugging
To debug an application, you should attach the debugger to the application process. Thus, you have several options for starting a debugging session:
Start the application with the attached debugger (in the debug mode).
If the application is already running, attach the debugger to it. This way of debugging is convenient if you develop the application in JetBrains Rider, but (for some reasons) are not able to launch it directly from your IDE.
In Windows, you can set JetBrains Rider as the default just-in-time (JIT) debugger and start it each time a process calls for the JIT debugger.
Start an application and debug it, do one of the following
Select the run/debug configuration to execute, and then do one of the following:
Click
 on the toolbar.
 Choose from the main menu.
Press Alt+F5.
Press Alt+Shift+F9, select a run/debug configuration from the popup, and press Enter.
Attach to a local process and debug it
Launch the process intended for debugging. You can do it from your operating system or using the JetBrains Rider terminal.
To find the process to attach to, do one of the following:
Press Ctrl+Alt+P.
Choose from the main menu.
From the list of available processes that appears, select the desired process. Simplify your search by typing the first letters of its name or PID.
Rider remembers processes that you attached to previously, and displays them at the top of the list.The debugger will attach to the application.
Use JetBrains Rider as the default JIT debugger
Press Ctrl+Alt+S or alternatively select from the main menu, then choose on the left.
Click Set rider as default debugger.
When JetBrains Rider is set as the default JIT debugger and a process calls
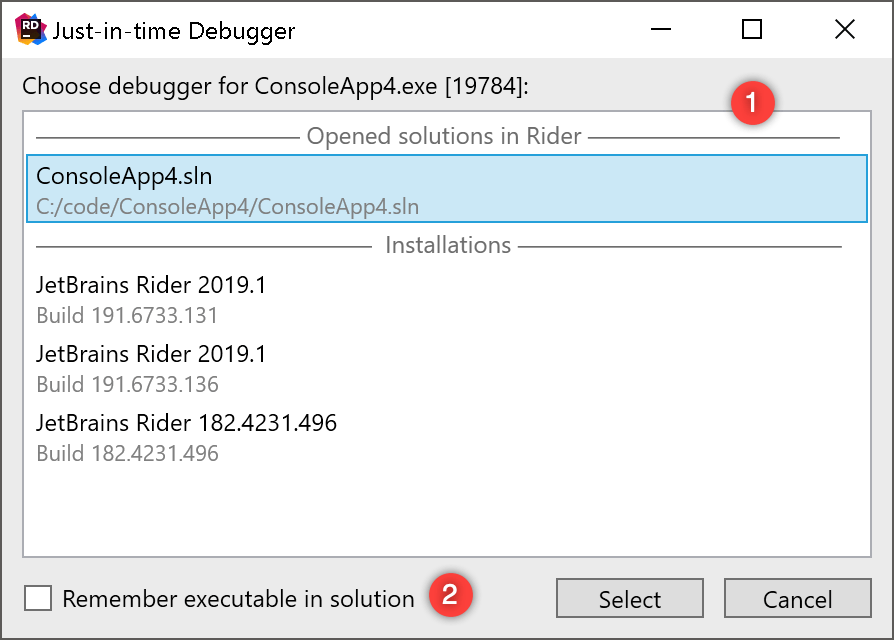
Debugger.Launch, you will see a dialog that helps you choose how to start the debugger. (1) If the solution with the application source code is open, you can pick it from the list of opened solutions.
Alternatively, you can choose a JetBrains Rider installation. In this case, debugger will start in an empty solution, and you will be able to debug decompiled code of the process. An additional checkbox allows you to remember the selected option (2), in which case for every future attempt, the debugger will be attached automatically:
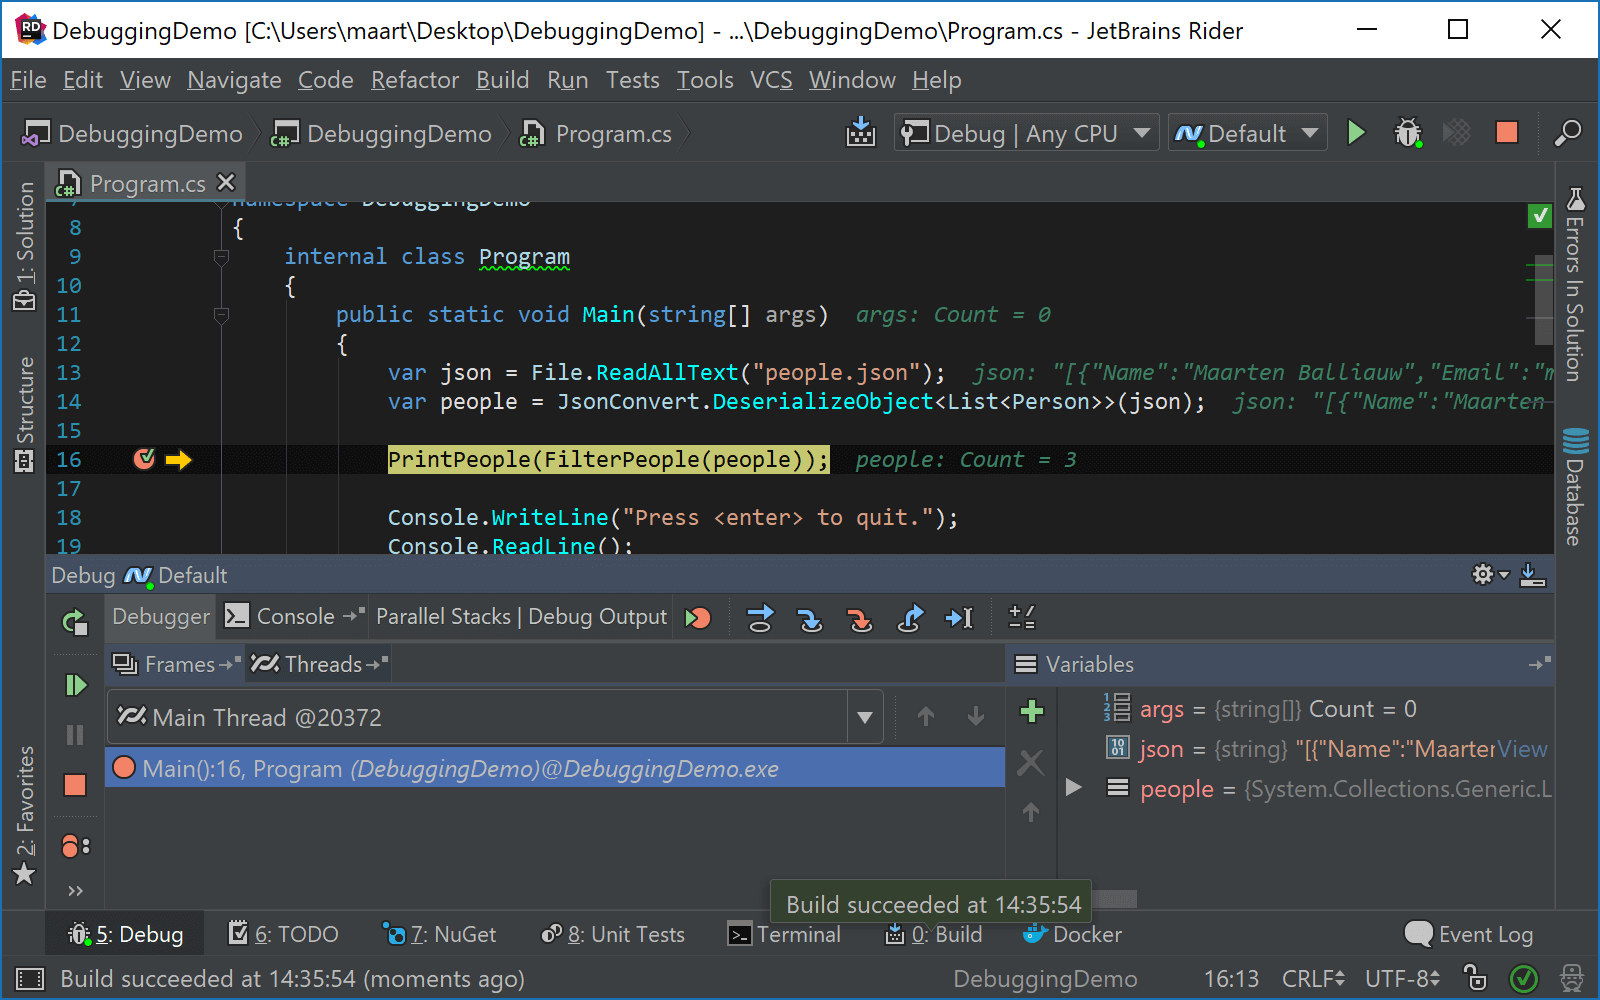
Once the session is started, proceed with debugging: (set more breakpoints, step through, pause and resume the process, evaluate expressions and so on).
To finish the debugging session, press Shift+F5, select in the menu, or click Stop ![]() in the Debug window. This will detach the debugger from the application and make the application exit (in case you have run it from JetBrains Rider).
in the Debug window. This will detach the debugger from the application and make the application exit (in case you have run it from JetBrains Rider).
While debugging, you can perform the most common debugger actions from the Alt+Enter menu. For example Run to Cursor, Skip to Cursor or Toggle breakpoints:
