Navigate from Stack Trace to Exception
Ctrl+E, T
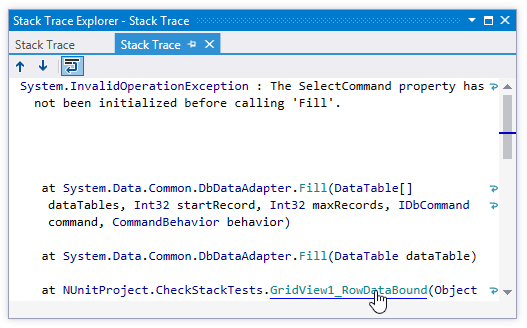
When you receive an external stack trace (for example, from a bug report), you can open it in the Run window and navigate to code where the corresponding exception originated. In the stack trace, files, types, and methods are displayed as hyperlinks. You can click them to display the corresponding items in the editor.
Navigate to code that caused an exception
Copy exception stack trace to the clipboard.
Press Ctrl+E, T or choose from the main menu. Alternatively, you can press Ctrl+Shift+A, start typing the command name in the popup, and then choose it there.
In the Stack Trace Explorer window, click highlighted items to display the corresponding code in the editor.
If you prefer to wrap long lines in the stack trace, use the corresponding toolbar button


Last modified: 08 March 2021