Value Tracking
Value Tracking helps you investigate value of a particular type and possibly determine how a certain incorrect value might have passed to a given point in your program, and where it might be passed next. This helps you investigate possible NullReferenceException, inappropriate behavior, and reasons why you get incorrect values.
Investigate member's value origins
Place the caret at the name of a method, property, variable, field, and so on, whose value you want to investigate.
Press Ctrl+Alt+Shift+A and choose Value Origin in the Inspect This list.
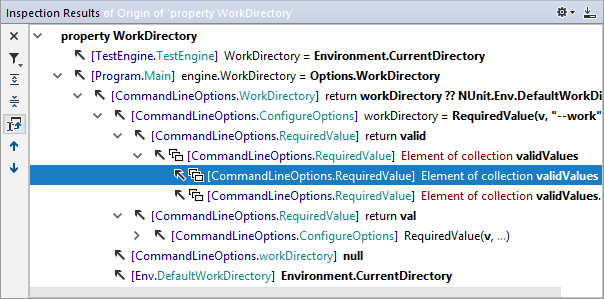
In the Inspection Results window that opens, you can investigate possible origins of the value.

Investigate member's value destinations
Place the caret at the name of a method, property, variable, field, and so on, whose value you want to investigate.
Press Ctrl+Alt+Shift+A and choose Value Destination in the Inspect This list.
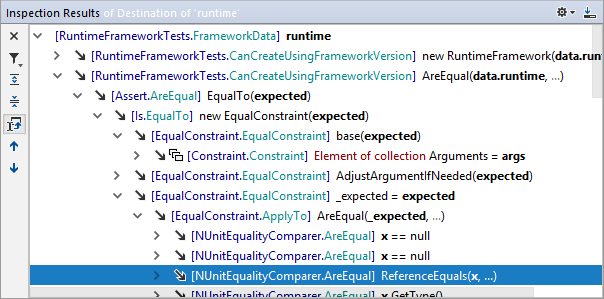
The Inspection Results window opens where you can investigate possible destinations of the value.

If a node represents an element of a collection, it is marked with ![]() ; if there is a lambda expression, it is marked with
; if there is a lambda expression, it is marked with ![]() .
.