Analyze Coverage of Unit Tests
The most basic scenario of using dotCover is measuring how much of your code is actually executed when you run unit tests. Baseline conditions are as follows: you have a solution opened in JetBrains Rider and code in the solution is covered with some unit tests. The task is to understand how much of the code is covered.
Analyze coverage of unit tests in a solution
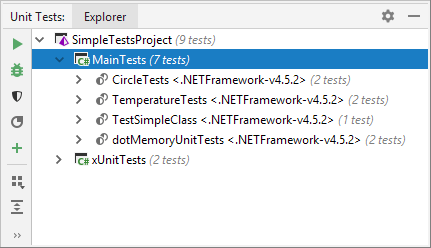
Choose from the main menu. This will open the Unit Test Explorer tool window. Here you can take a look at how many tests are there in the solution.

In the Unit Test Explorer window, select the tests whose coverage you want to analyze. If you want to analyze all tests, select the top-level node in the tree.
Click Cover Unit Tests
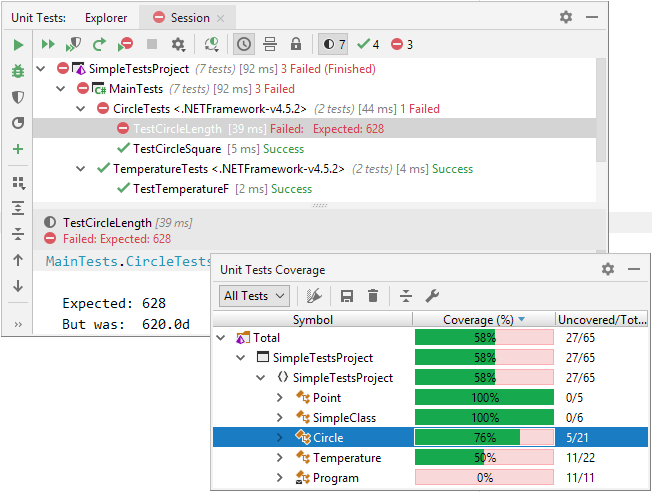
 . This will run a normal unit tests session but dotCover will collect coverage data in the background. Test results will be shown in real time in the newly opened session tab. Coverage results (how tests cover particular classes and methods in your code) will be shown in the Unit Test Coverage tool window.
Visualize code coverage by clicking Highlight code
 .
. 
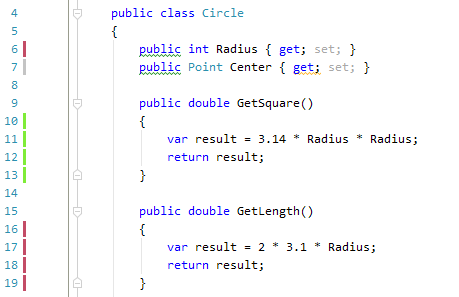
By default, coverage and test results are shown by markers in the left gutter of the editor: a marker is red if any tests related to the current statement are failing, green if all tests are passing, and grey if there are no tests covering this statement.