Evaluate expressions
With JetBrains Rider, you can not only view values of separate variables, but also evaluate more complex expressions, such as method calls, operator expressions, lambda expressions, and anonymous classes.
Expressions are evaluated in the context of a stack frame currently selected in the Frames pane of the Debug window
Evaluate expressions in the editor
The easiest way to evaluate expressions is to use editor tooltips. If the value of a variable or an expression contains child elements, clicking expands the node and displays all children.
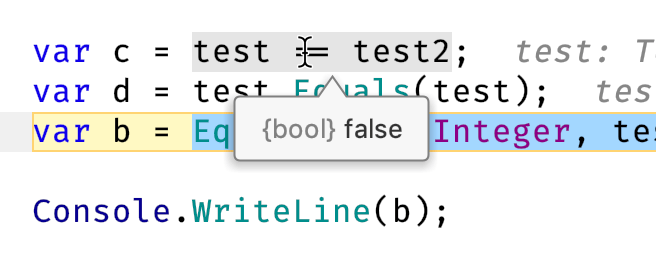
When Show value tooltip is enabled on the Build, Execution, Deployment | Debugger | Data Views page of the IDE settings Ctrl+Alt+S, you can hover the mouse over variables and expressions to see the evaluated results:

When Show value tooltip on code selection is enabled on the Build, Execution, Deployment | Debugger | Data Views page of the IDE settings Ctrl+Alt+S JetBrains Rider shows the evaluation result for the selected expression.
You can extend or shrink the selection with Ctrl+W/ Ctrl+Shift+W thus changing the evaluated expression:

You can also invoke the value tooltip on a variable, expression, or selection with the Quick Evaluate Expression command (Ctrl+Alt+F8 or Run | Quick Evaluate Expression or Alt -click).
Evaluate arbitrary expressions in the dedicated dialog
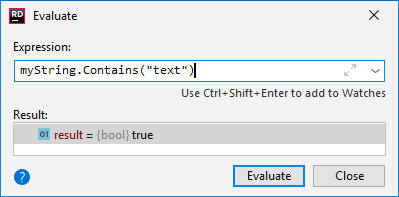
The Evaluate dialog lets you play with variables and expressions in the current context — you can perform various operations and call methods on them, and then analyze results that you get with their current values
For example, if there is a String myString variable in the current context, you can enter the following expression to check whether the current value of the variable contains a substring: myString.Contains("text")
The Evaluate dialog is non-modal, so you can switch the focus back to the editor to copy other variables and expressions, and you can also open multiple Evaluate dialogs if necessary.
While evaluating expressions, mind the following
A method can be invoked in the Evaluate dialog only if the debugger has stopped at a breakpoint, but has not been paused.
Expression evaluation can only be "single-level". In other words, if JetBrains Rider stops at a breakpoint within a method called from the Expression Evaluation, you cannot use the Expression Evaluation feature again.
Evaluate an arbitrary expression
If you want to start with some expression or a variable, select it in the editor or in any view in the Debug window.
Open the Evaluate dialog in one of the following ways:
Press Alt+F8.
Select from the context menu.
Choose from the main menu.
Click
on the toolbar of the Debug window.
If you have selected something at the first step, the variable or expression will be displayed in the Expression field. Otherwise, type the expression in the field or choose one of the previously evaluated expressions from the list.
Press Enter or click Evaluate. The read-only Result field will show the evaluation output.
If you have assigned a label to an object, you can reference it by this label $[label_name].
If the specified expression cannot be evaluated, the Result field explains the reason.
If you want to edit a multi-line expression or a code fragment, click
in the Expression field or press Shift+Enter to switch to the multi-line Code fragment view and back.
To switch between the evaluated fragments, press Alt+Down and Alt+Up.
Optionally, you can select another thread where you want an expression to be evaluated in the Frames pane of the Debug window.