Explore and navigate exception stack traces
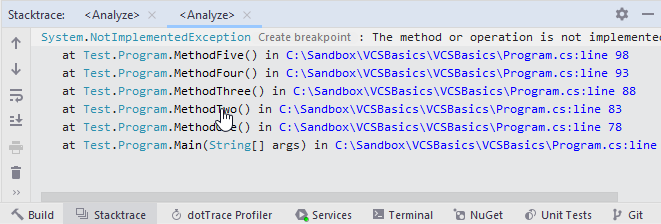
When you receive an external stack trace (for example, from a bug report), you can open it in the dedicated Stacktrace window and then navigate to code where the corresponding exception originated. In this window, you can click files, types, and methods to display them in the editor.
Each stack trace is opened in a new tab, which stays available until you close it or close the solution. If you close the Stacktrace window, you can reopen it by choosing from the menu.
Navigate to code that caused an exception
Copy exception stack trace to the clipboard.
Press Ctrl+E, T or choose from the main menu . Alternatively, you can press Ctrl+Shift+A, start typing the command name in the popup, and then choose it there.
The Stacktrace window opens displaying the exception stack trace from the clipboard in a new tab.
Study the stack trace and click highlighted items to open the corresponding code in the editor.
To navigate to the next or previous frame in the stack trace, press Ctrl+Alt+Down/Ctrl+Alt+Up or choose from the main menu.
These commands will also open the corresponding method calls in the editor. They will work when the Stacktrace window is open, even if the application focus is in the editor.
If you prefer to wrap long lines in the stack trace, use the corresponding toolbar button


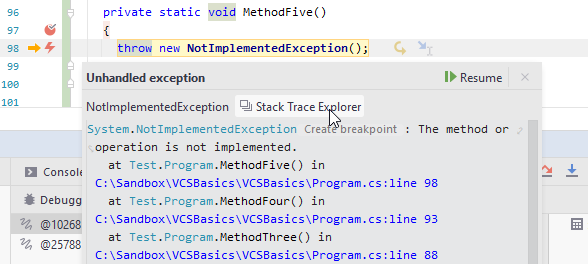
When the code that you are debugging throws an exception, you can click Stack Trace Explorer in the exception popup to study the exception right away or later in the Stacktrace window:
