Unit Testing Assistance in C++
JetBrains Rider helps discover, run, and debug unit tests of the following unit testing frameworks :
With JetBrains Rider, you can execute a single unit test, all tests in a file, project or solution. You can also execute any number of tests combined in a test session.
Discovering tests in the current document
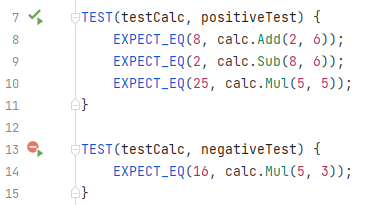
JetBrains Rider discovers unit tests right in the editor and adds the corresponding action indicators next to each item in the editor:

A unit test that you can run or debug | |
| The unit test has passed during the last execution. |
| The unit test has failed during the last execution. |
Run, debug, or cover tests in the current document
There are several ways to run, debug, or cover unit tests in the current document. You can use action indicators, main menu or shortcuts:
To run, debug, or cover a single test or all tests in a test class, click the action indicator next to it or set the caret at the test and press Alt+Enter. In the action list, choose Run/Debug or Cover or Cover All for a test class.
Alternatively, you can use the Run Unit Tests
 Ctrl+;, R/ Debug Unit Tests
  Ctrl+;, D or Cover Unit Tests
 .png) commands, which are also available in the main menu ( ) and in the context menu. These commands work differently depending on the caret position or selection in the editor:
commands, which are also available in the main menu ( ) and in the context menu. These commands work differently depending on the caret position or selection in the editor:To run, debug, or cover a single test , set the caret at the test name, or anywhere inside its declaration in the editor .
To run several tests, select the desired tests in the editor .
Whatever way you choose to run, debug, or cover tests, you will see the execution progress, results, and output in the Unit Tests window. If there is an open unit test session, the executed tests are added to that session. If there are no test sessions or the existing ones are locked, then a new tests session is created.
If necessary, you can always repeat execution or coverage analysis of the tests that you executed last by pressing Ctrl+;, T or choosing in the menu.
You can also re-run tests that failed by pressing Ctrl+;, F or choosing in the menu.
Discover unit tests in solution
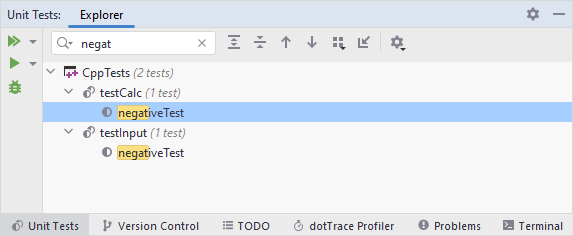
For unit test management, JetBrains Rider provides the Unit Tests window ( ). Using this window, you can explore and run, debug, or cover unit tests in the entire solution. Note that unit tests from a project only appear in the window after the project is built. Tests from currently opened files are updated automatically, new tests from the opened files appear in the unit test explorer as soon as you create them.
In the unit test explorer, you can:
Explore tests in the solution: browse all unit tests in a tree view, search tests and filter by a substring, regroup unit tests by project, namespace, and so on.
Navigate to source code of any test by double-clicking it in the view.
Run, debug, or cover selected tests.
Create unit tests sessions from selected tests and/or add selected items to the current test session.

Run, debug, or cover unit tests in project or solution
You can run, debug, or cover tests from the Unit Test Explorer or Solution Explorer. Unit Test Explorer gives you the advantage to see only tests , while using other windows you need to know, which projects, files, and classes contain tests.
To execute tests from Unit Test Explorer, select the desired tests and click Run Unit Tests
 Ctrl+;, R/ Debug Unit Tests
  Ctrl+;, D or Cover Unit Tests
 .png) on the toolbar.
on the toolbar. To run, debug, or cover all tests in solution, choose in the main menu or press Ctrl+;, L.
Whatever way you choose to run, debug, or cover tests, you will see the execution progress, results, and output in the Unit Tests window. If there is an open unit test session, the executed tests are added to that session. If there are no test sessions or the existing ones are locked, then a new tests session is created.
If necessary, you can always repeat execution or coverage analysis of the tests that you executed last by pressing Ctrl+;, T or choosing in the menu.
You can also re-run tests that failed by pressing Ctrl+;, F or choosing in the menu.
Unit test sessions
You can group unit tests that target specific parts of your application into multiple unit test sessions. A unit test session can contain tests from different projects. You can have multiple test sessions and run them separately as needed. A single test can be included in several different test sessions.
For detailed instructions related to unit test sessions, see Unit test sessions.
Execution process
JetBrains Rider provides several ways to execute unit tests. Whichever way you choose, execution progress, test results, and output are displayed in the Unit Tests window, coverage results are shown in the Unit Test Coverage window.
As tests are running in a unit test session, the progress icon is displayed next to the currently executing test. You can run multiple unit test sessions simultaneously. However, when you debug tests, only one test session can be executed at a time.
When you run or debug unit tests, JetBrains Rider uses the Command and Working Directory configuration parameters specified in the project properties. To access these properties, right-click the project in the Solution Explorer and choose .

Analyze execution results and output
When the execution is over, the results are visualized in the Unit Tests window.
The output pane (which you can place on the right or at the bottom using the Toggle output position ![]() button on the toolbar) displays output of the selected test.
button on the toolbar) displays output of the selected test.
By default, JetBrains Rider wraps long lines in the output according to the current width of the output area. If necessary, you choose not to wrap long lines by clearing the Wrap long lines in Unit Test Session output checkbox on the page of JetBrains Rider settings Ctrl+Alt+S.
Use the Group by ![]() selector on the toolbar to change grouping of the tests — you can either choose one of the predefined grouping modes in the upper part of the selector, such as Test Hierarchy, Project Structure, and so on, or use the lower part of the selector to choose a custom set of grouping properties.
selector on the toolbar to change grouping of the tests — you can either choose one of the predefined grouping modes in the upper part of the selector, such as Test Hierarchy, Project Structure, and so on, or use the lower part of the selector to choose a custom set of grouping properties.
On the status bar, you can see the total number of tests in the session as well as number of tests in different states:
![]()
By default, tests in all states are shown, but you can click the corresponding icons to filter tests by their state.
Status of each test in the Unit Test Sessions window is displayed with one of the following icons:
| Unit test is currently executing |
| Unit test is scheduled for execution in the current run |
| Unit test was not executed |
| Unit test passed in the lats test run |
| Unit test failed in the lats test run |
| Unit test was ignored in the last test run |
| Unit test was started but JetBrains Rider could not read the test runner output. This normally happens when you abort test execution, but could also be a sign of an error occurring in the test runner. |
The same icons are used to display status of grouping items
The icons are also used on each session's tab to display the overall execution result of the sessions.
The corresponding icons above the test session tree show how many tests are in each of the states. The ![]() icon shows the total number of tests in the session.
icon shows the total number of tests in the session.
Using these icons, you can filter the tree so that only tests in the corresponding status are displayed.
When your focus is in the Unit Tests window, you can use simplified shortcuts for unit testing actions. For example, you can use Ctrl+D instead of Ctrl+;, D for debugging selected tests. Here is the full list of extra shortcuts that work in the Unit Tests window:
Shift+Enter — Run Selected Tests
Ctrl+D — Debug Selected Tests
Ctrl+Y — Run Current Session
Alt+Shift+Insert — Create New Session
Ctrl+Alt+Insert — Append Selected Tests to Session
Delete — Remove Selected Tests
Ctrl+L — Run All Tests from Solution