Debug Unity Applications
JetBrains Rider allows you to debug Unity game scripts using all the power of the debugger, including conditional and dependent breakpoints, watches, expression evaluation, and so on.
Debug a Unity application on a local computer
Make sure the project you want to debug is opened in the Unity editor.
In JetBrains Rider, open the corresponding Unity project solution.
Set breakpoints by clicking the gutter next to a required line of code.
Select the Attach to Unity Editor & Play run configuration.
Start a debugging session by doing one of the following:
Click
 on the toolbar.
Choose from the main menu.
Press Shift+F9.
Debug a Unity application on a remote device
Make sure the project you want to debug is opened in a Unity player on the remote device.
In JetBrains Rider, open the corresponding Unity project solution.
Set breakpoints by clicking the gutter next to a required line of code.
Make sure the Development Build and Script Debugging options are selected in Unity's Build Settings.
Make sure the remote device is visible to the current network, and firewall rules allow incoming UDP messages for the current process.
If you use an Apple USB device, make sure iTunes or the Apple Mobile Device service are installed.
In the main menu, select .
In the opened window, click Add player address manually and specify Host IP address and Port for connecting to the Unity player.
Select the Unity process in the list and click OK.
Run the application using the Play button in Rider or in the Unity player.
When developing games for Android, it is often necessary to debug the game on a physical Android device to ensure that it works correctly. One way of doing that is through USB using the Android Debug Bridge (adb) — a command-line tool included in the Android SDK.
Debug a Unity application on Android devices via USB with adb
Open the Unity project in a version of Unity where Android support is included.
Change the build target to Android using the Build Settings dialog and build and deploy to a connected Android device via USB.
In Rider, choose from the menu and select the Android device and Unity project to debug. Multiple Unity projects running on the device will be listed separately.
Add a breakpoint and debug as normal. The temporary run configuration created automatically can be reused for quick reattachment.
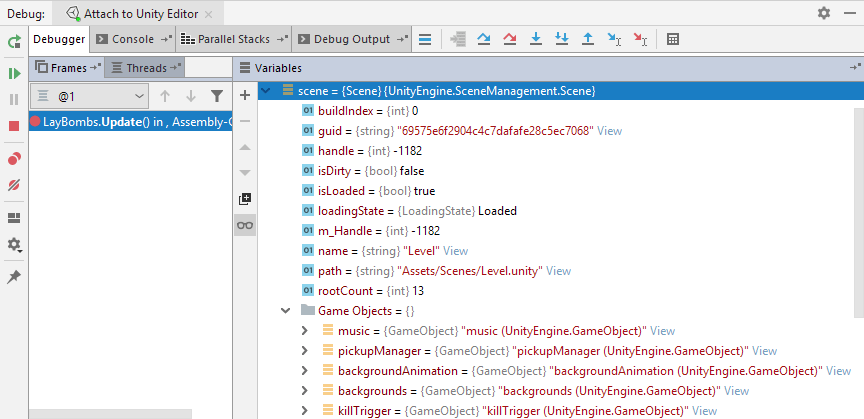
Note that when debugging a Unity application, the debugger shows some extra data for Unity objects. For example, when looking at a Scene in the debugger, you will now see a list of root game objects, and each GameObject will show child game objects and attached components. ECS Entity objects will also show component data.

Using Unity pausepoints
A pausepoint is a new type of debugger breakpoint that does not suspend the execution of your code but instead pauses the Unity Editor at the end of the current frame. This lets you set a pause condition in the code (for example, hit a button, reach a certain health value, or just go down a certain code path) and then use the Unity editor's Inspector window to inspect the current state of the game. So, unlike a breakpoint, a pausepoint does not suspend the Unity editor.
To set a Unity pausepoint
Set a breakpoint by clicking the gutter next to a required line of code.
Right-click the breakpoint and in the context menu, choose Convert to Unity pausepoint.

Set an additional condition or a hit count for the pausepoint.
Once execution reaches the pausepoint, the Unity editor will switch to the pause mode letting you inspect the current state of your game or even change any values.
Troubleshooting debugging Unity players
If you have some problems debugging Unity players, refer to the troubleshooting page of the Unity plugin GitHub repo.