Analyze profiling results
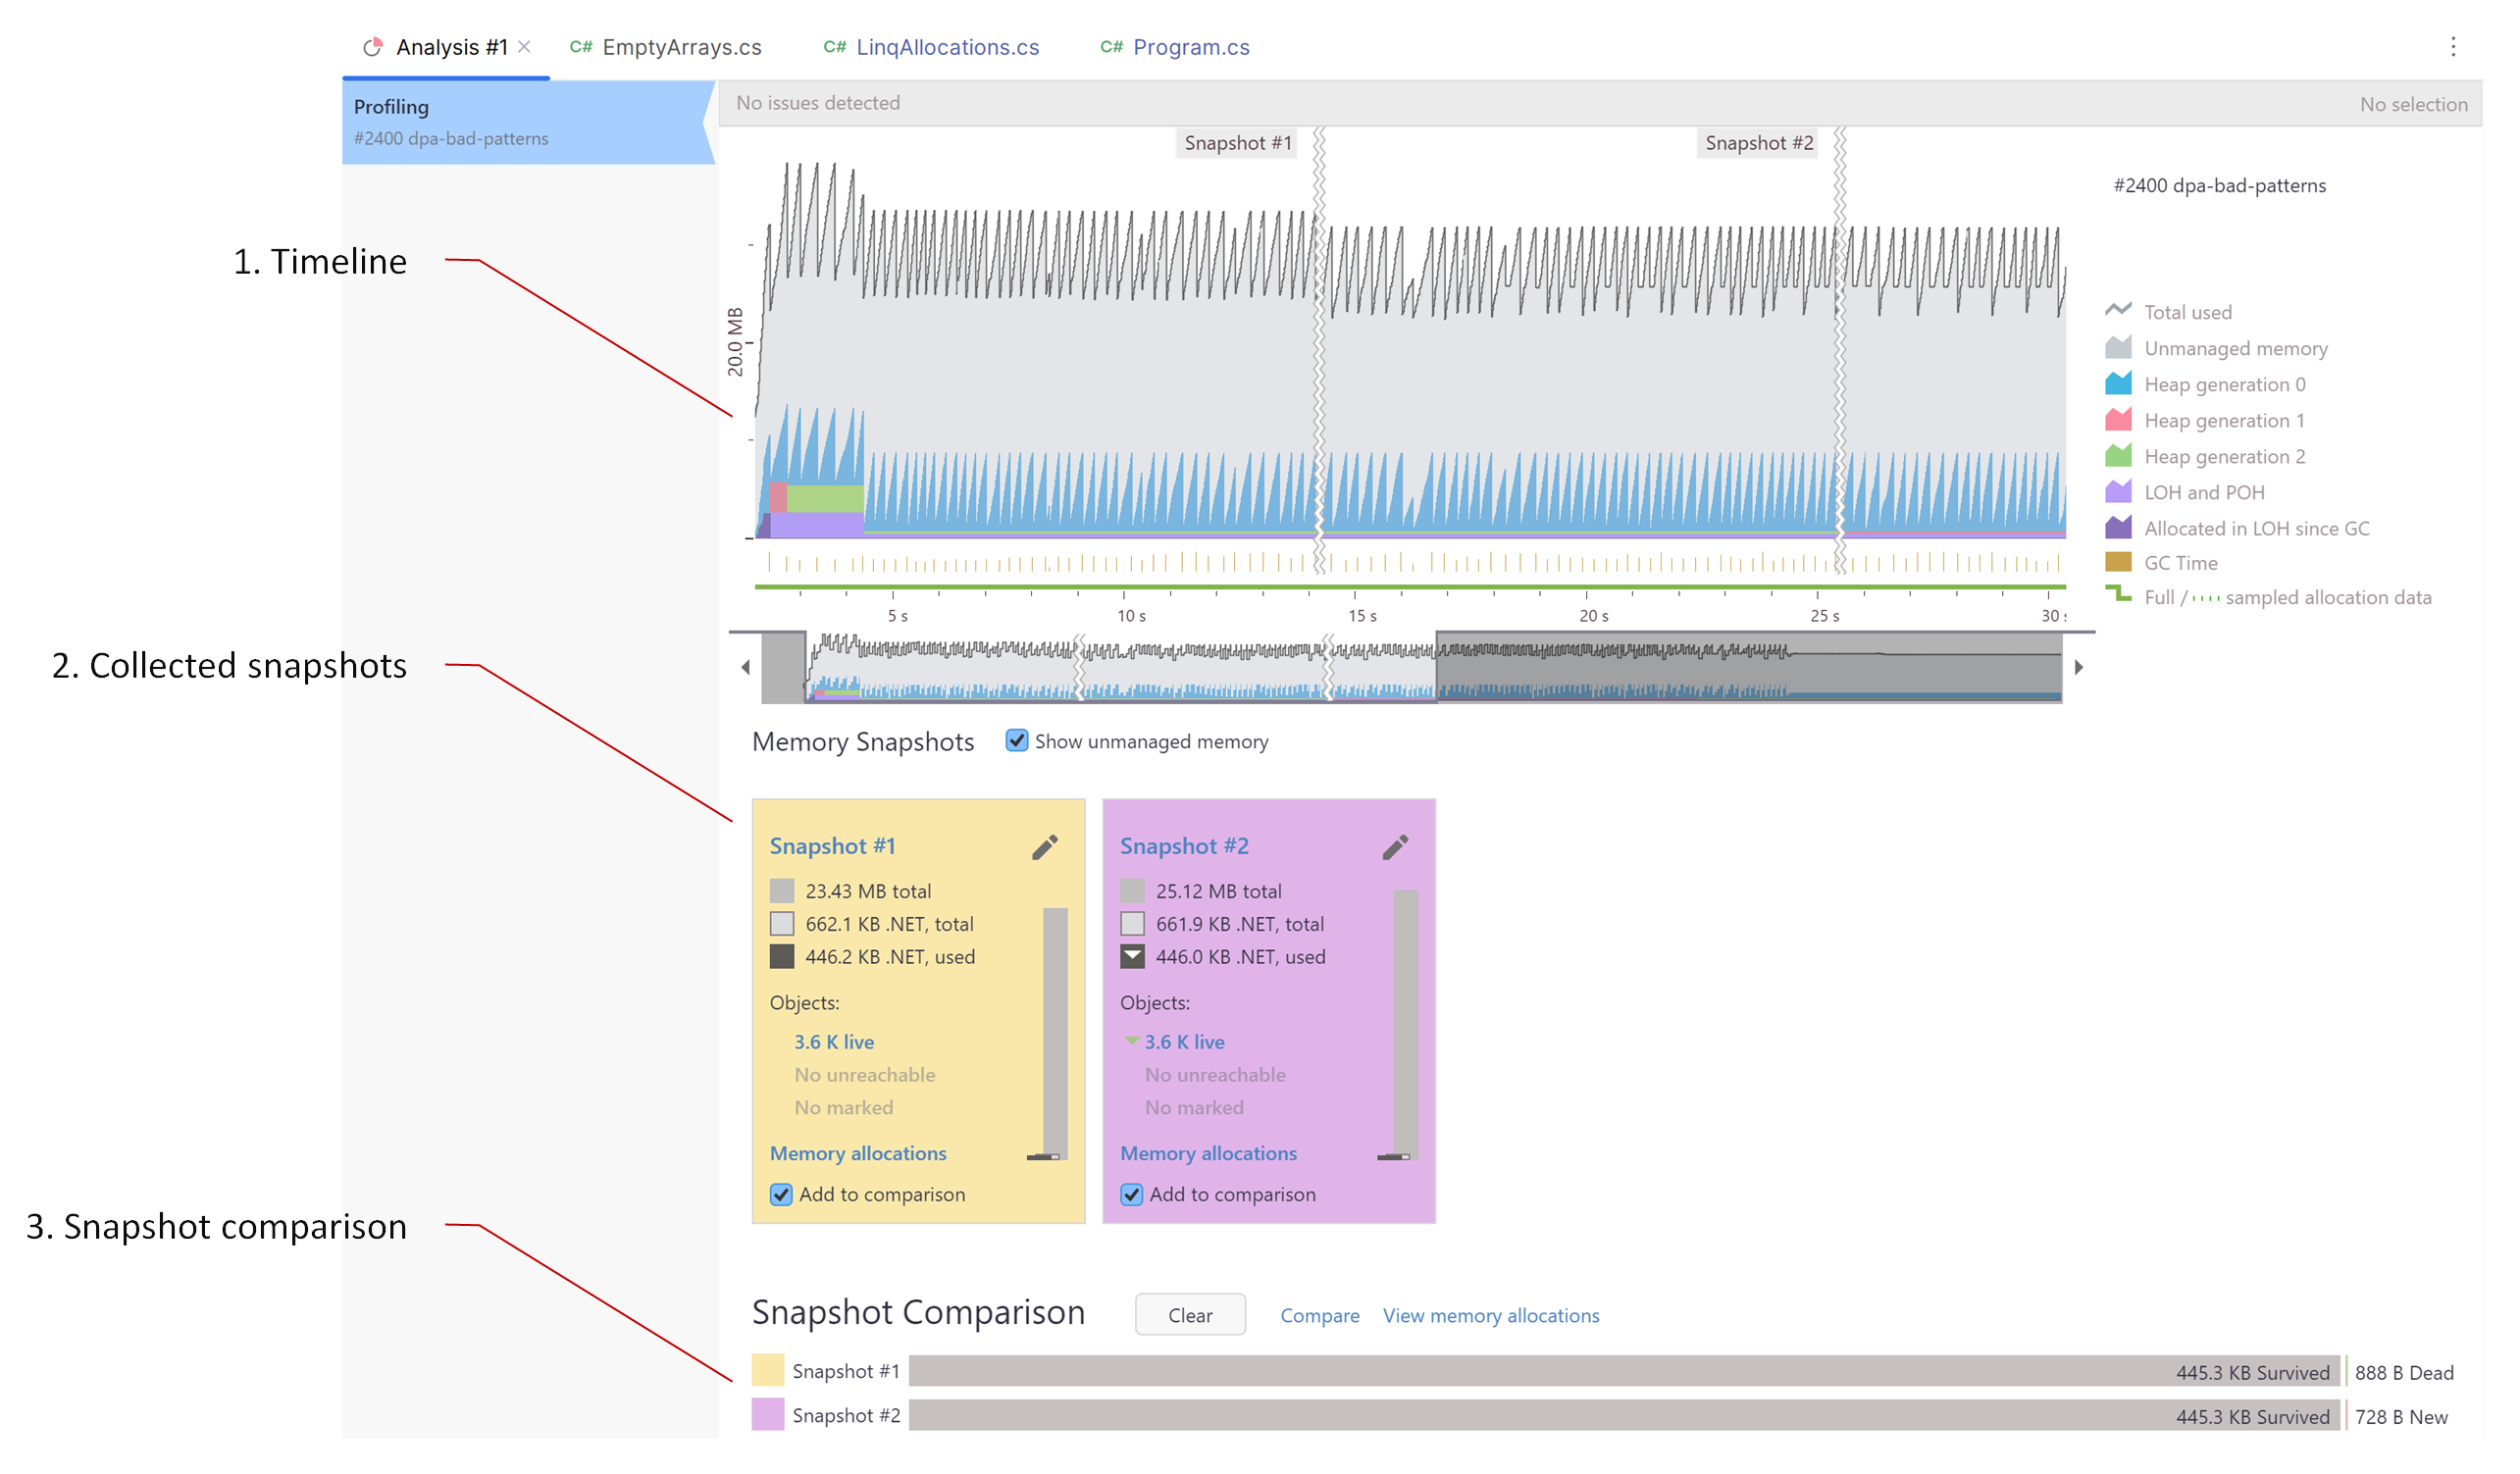
After you finish the profiling session, your Analysis document window will look like this:

With dotMemory, you can analyze the following data:
Memory allocation data (1)
Memory allocation analysis allows tracing the allocation of objects in the memory during the execution of your application. It lets you identify the types of objects that were created and the methods responsible for their creation. In essence, it answers the question, "Where and how is memory being allocated in my application?". In the Analysis document window, memory allocation data is displayed on the timeline (1).
Memory snapshots (2)
A memory snapshot is a snapshot of the managed heap at a particular moment in time. It allows you to explore the objects that are currently in memory and analyze their retention paths. In essence, it answers the question, "What is in memory at a particular moment in time?".
Learn how to analyze object sets and specific instances
Snapshot comparison (3)
This involves comparing two or more memory snapshots to identify new, dead, and survived objects. New objects are those created between the snapshots, dead objects are ones that have been garbage collected, and survived objects persist across the snapshots. This analysis is helpful for observing memory usage over time and detecting potential memory leaks.
Learn how to compare snapshots