Issue detection
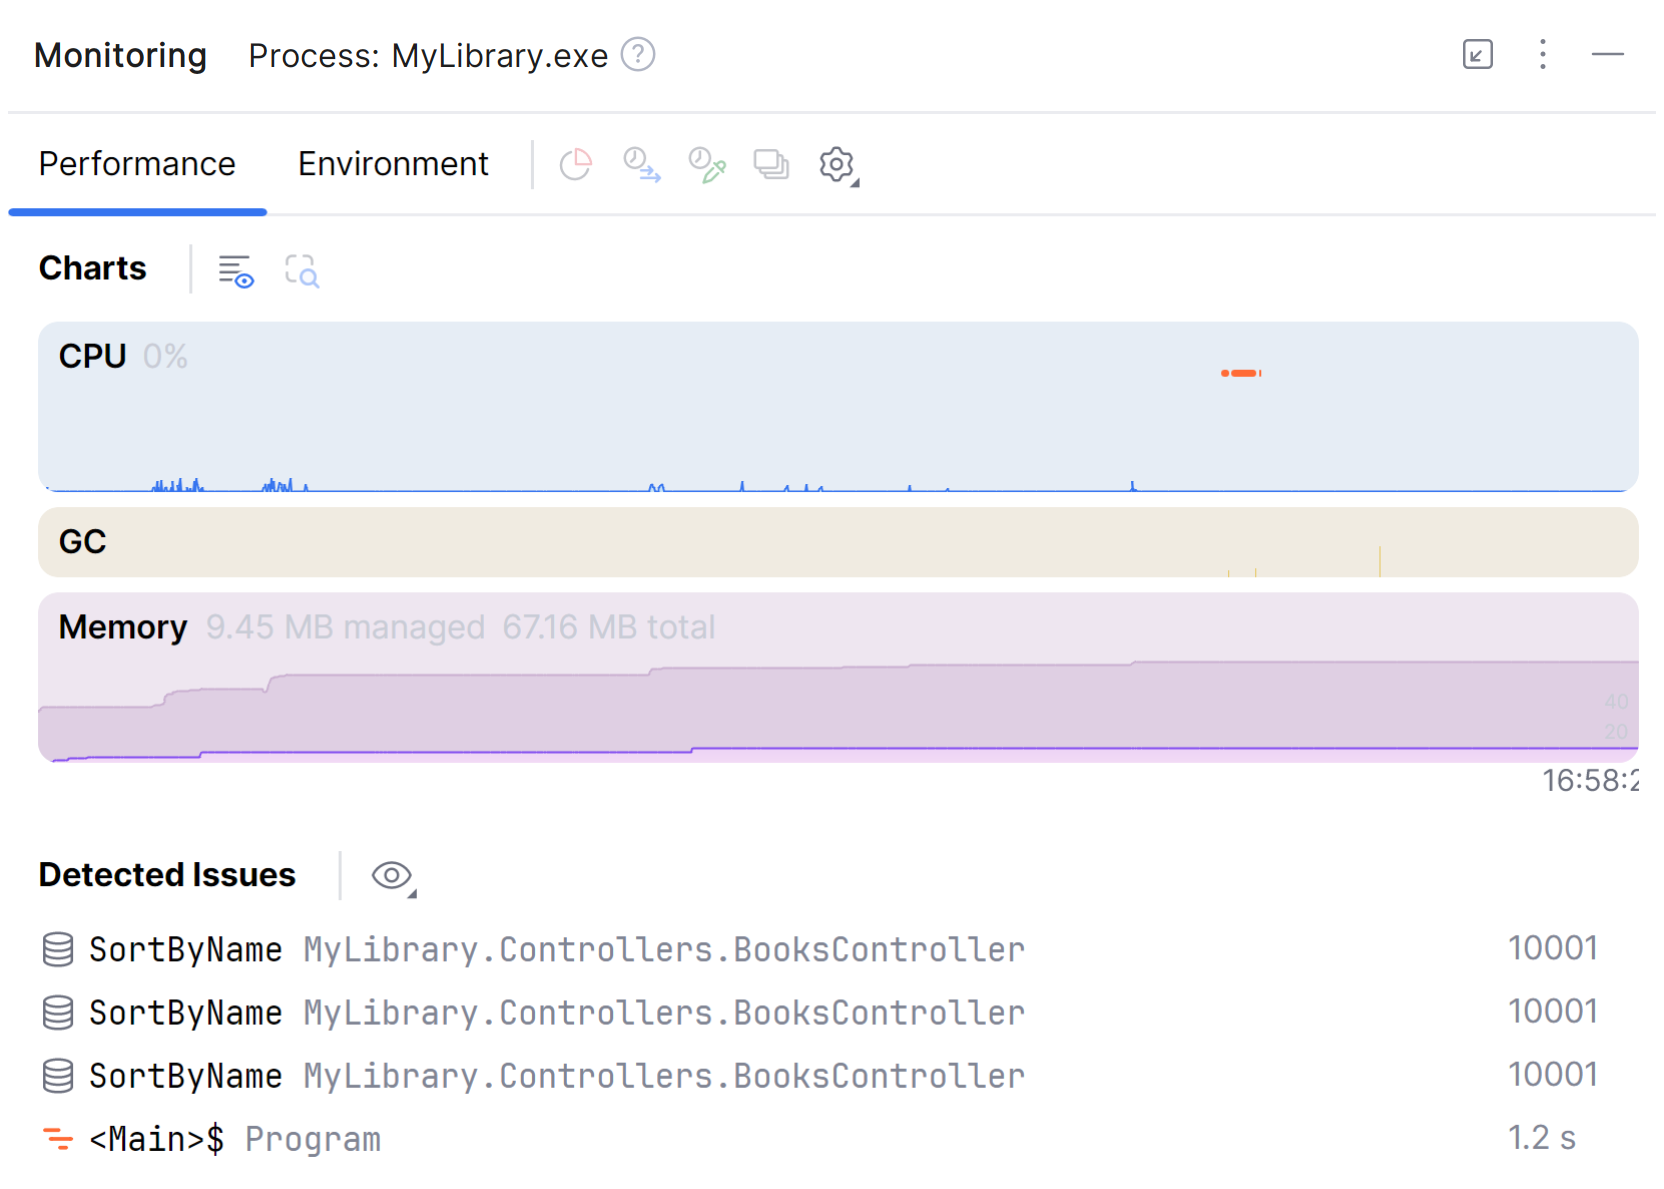
On Windows, the Monitoring tool can automatically detect various types of runtime performance issues in your application. It runs during debugging or normal run and identifies potential problems such as UI freezes, long-running database commands, or slow ASP.NET Core requests.
Detected issues appear in the Detected Issues section of the Monitoring tool window, where you can review them, navigate to the related code, or analyze the methods that caused them using the integrated dotTrace Profiler.

dotUltimate license requirement
Issue detection is available for all users. However, detailed issue analysis in dotTrace requires a dotUltimate or All Products Pack license.
Without the license, the issues are reported only with an issue type and a metric value (without the method and type names).

Issue types and default thresholds
Monitoring detects several types of issues. Each issue type has a configurable threshold. When its metric exceeds the threshold, the issue is reported in the Monitoring tool window. You can customize these thresholds in .
Basic performance issues
Performance hotspot – a time interval where one or more user methods consumed a significant portion of total execution time. Default threshold: 500 ms.
UI freeze – a time interval where the UI was unresponsive for more than the specified threshold (no window messages were pumped or processed). Default threshold: 500 ms.
High GC activity – a time interval where the specified percentage of the total execution time was spent on garbage collection. Significant GC activity can indicate memory pressure or excessive memory allocation in your application. Default threshold: 20%.
Database issues
Slow DB command – database commands whose execution time exceeds the threshold. Default threshold: 1000 ms.
Excessive DB commands – repeated execution of the same database command (for example, an N+1 query pattern). Default threshold: 100 commands.
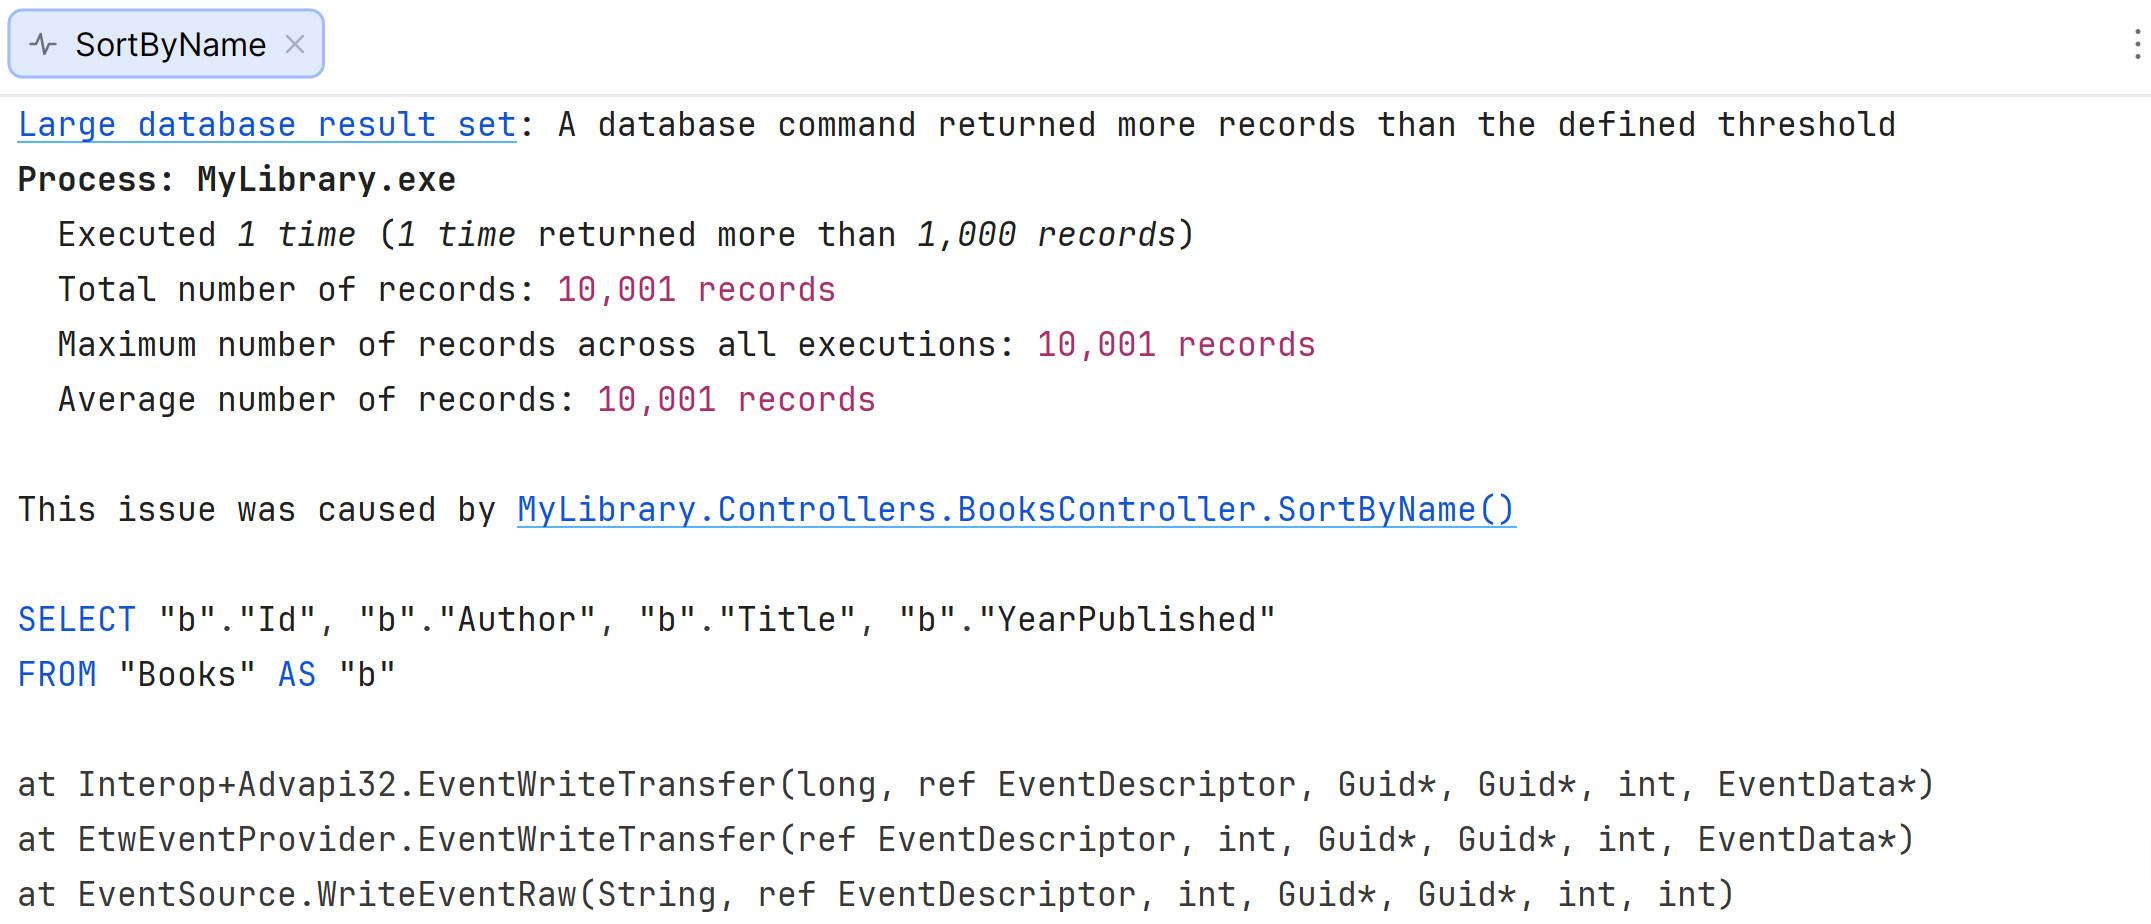
Large DB result set – database commands returning more records than the threshold. Default threshold: 1000 records.
Excessive DB connections – code that opens too many simultaneous database connections. Default threshold: 50 connection.
ASP.NET Core issues
Slow MVC action – controller actions whose execution time exceeds the threshold. Default threshold: 1000 ms.
Slow Razor page handler – long-running Razor page handler methods (for example,
OnGet,OnPost). Default threshold: 1000 ms.Slow Razor view component – slow
Invoke()orInvokeAsync()methods in view components. Default threshold: 1000 ms.
Analyze detected issues
The Monitoring tool lets you analyze detected issues in more detail. You can right-click any issue to:
Analyze Issue – to view issue details in the editor.

Select Issue Range – to select the issue time range on the monitoring timeline. After you select the range, click
 Analyze selected time range button on top of the Charts tab. This will open the issue time range in the dotTrace tool window where you can view the call tree and event data. Learn how to analyze the data using dotTrace
Navigate to {method-name} – to go to the method that caused the issue.
Configure issue detection
Monitoring considers an event an issue when its metric exceeds the configured threshold. You can change the thresholds or disable certain issue types.
Open .
Use the checkboxes to enable or disable individual issue types.
Adjust thresholds according to your project's performance targets.
Mute issues
If Monitoring detects an issue that you don't consider a real problem, for example, a false positive, code outside your control, or a case too minor to investigate, you can mute it. When you mute an issue, Monitoring adds a filter that tells it to exclude the corresponding code from analysis in future runs.
You can create such filters manually in the settings or directly from the Detected Issues list.
To mute an issue from the Detected Issues list:
In the Detected Issues list, right-click the issue.
Select Dismiss Issue. This creates a filter by method name.
You can view or change the created filter in the Do not analyze code in section of the page.
To create or manage filters manually:
Open .
In the Do not analyze code in section, add or remove filters by process, module, class, or method. You can also delete existing filters to "unmute" previously muted issues.