Work with unit tests in project or solution
Discover unit tests in solution
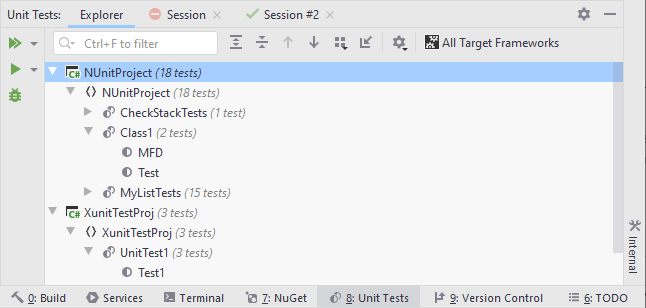
For unit test management, JetBrains Rider provides the Unit Tests window ( ). Using this window, you can explore and run, debug, or cover unit tests of all supported frameworks in the entire solution. Note that unit tests from a project only appear in the window after the project is built. Tests from currently opened files are updated automatically, new tests from the opened files appear in the unit test explorer as soon as you create them.
For NUnit, xUnit, and MSTest, you can prefer either speed or accuracy when discovering unit tests after the build. This is configurable with the following options on the page of JetBrains Rider settings Ctrl+Alt+S:
Metadata (default)
In this mode, JetBrains Rider analyzes the build artifact without launching the test runner.
As tests are defined using attributes, JetBrains Rider can quickly scan the metadata of managed artifacts to find most tests in the project. However, it may fail to find tests that require running some special hooks of the framework to define their parameters.
This is the fastest way of discovering tests.
Test runner
In this mode, JetBrains Rider launches the framework runner in the discovery mode on the build artifact, and then uses the results from the runner.
Using the framework runner can take considerably longer to analyze the project, but the list of discovered tests will be complete in most cases.

In the unit test explorer, you can:
Explore tests in the solution: browse all unit tests in a tree view, search tests and filter by a substring, regroup unit tests by project, namespace, category, and so on.
Navigate to the source code of any test or test class by double- clicking it in the view.
Run, debug, or cover selected tests.
Create unit tests sessions from selected tests and test classes and/or add selected items to the current test session.
Run, debug, or cover unit tests in project or solution
You can run, debug, or cover tests from the Unit Test Explorer or Solution Explorer. Unit Test Explorer gives you the advantage to see only tests and test classes, while when you use other windows, you need to know, which projects, files, and classes contain tests.
To execute tests from Unit Test Explorer, select the desired tests and click Run Unit Tests
Ctrl+;, R/Debug Unit Tests
Ctrl+;, D or Cover Unit Tests
.png) on the toolbar.
on the toolbar. To select multiple tests, select a grouping node or click the desired items while holding down the Ctrl key. Alternatively, type a query string in the search field to filter out all non-matching tests before execution — in this case only the remaining matching tests will be executed.
To run, debug, or cover all tests in solution, choose in the main menu or press Ctrl+;, L.
Whatever way you choose to run, debug, or cover tests, you will see the execution progress, results, and output in the Unit Tests window. If there is an open unit test session, the executed tests are added to that session. If there are no test sessions or the existing ones are locked, then a new tests session is created.
If necessary, you can always repeat execution or coverage analysis of the tests that you executed last by pressing Ctrl+;, T or choosing from the menu.
You can also re-run tests that failed by pressing Ctrl+;, F or choosing from the menu.