Debug Unreal Engine Project
With JetBrains Rider, you can set line breakpoints, watchpoints, conditional breakpoints, and others. You can also use evaluate expressions or set values during debugging sessions.
Natvis support
The LLDB-based debugger has support for Natvis files and automatically finds and loads the UE4.natvis, providing user-friendly views of Unreal Engine data types.
The following Visual Studio Natvis customization features are supported:
Inheritable attribute, which specifies whether a visualization applies only to a base type, or to a base type and all derived types.
Format specifiers, which control the format in which a value is displayed.
CustomListItems, which allows you to write custom logic for traversing a data structure. This is especially useful for the containers in Unreal 4.26 like
TMapandTSet.
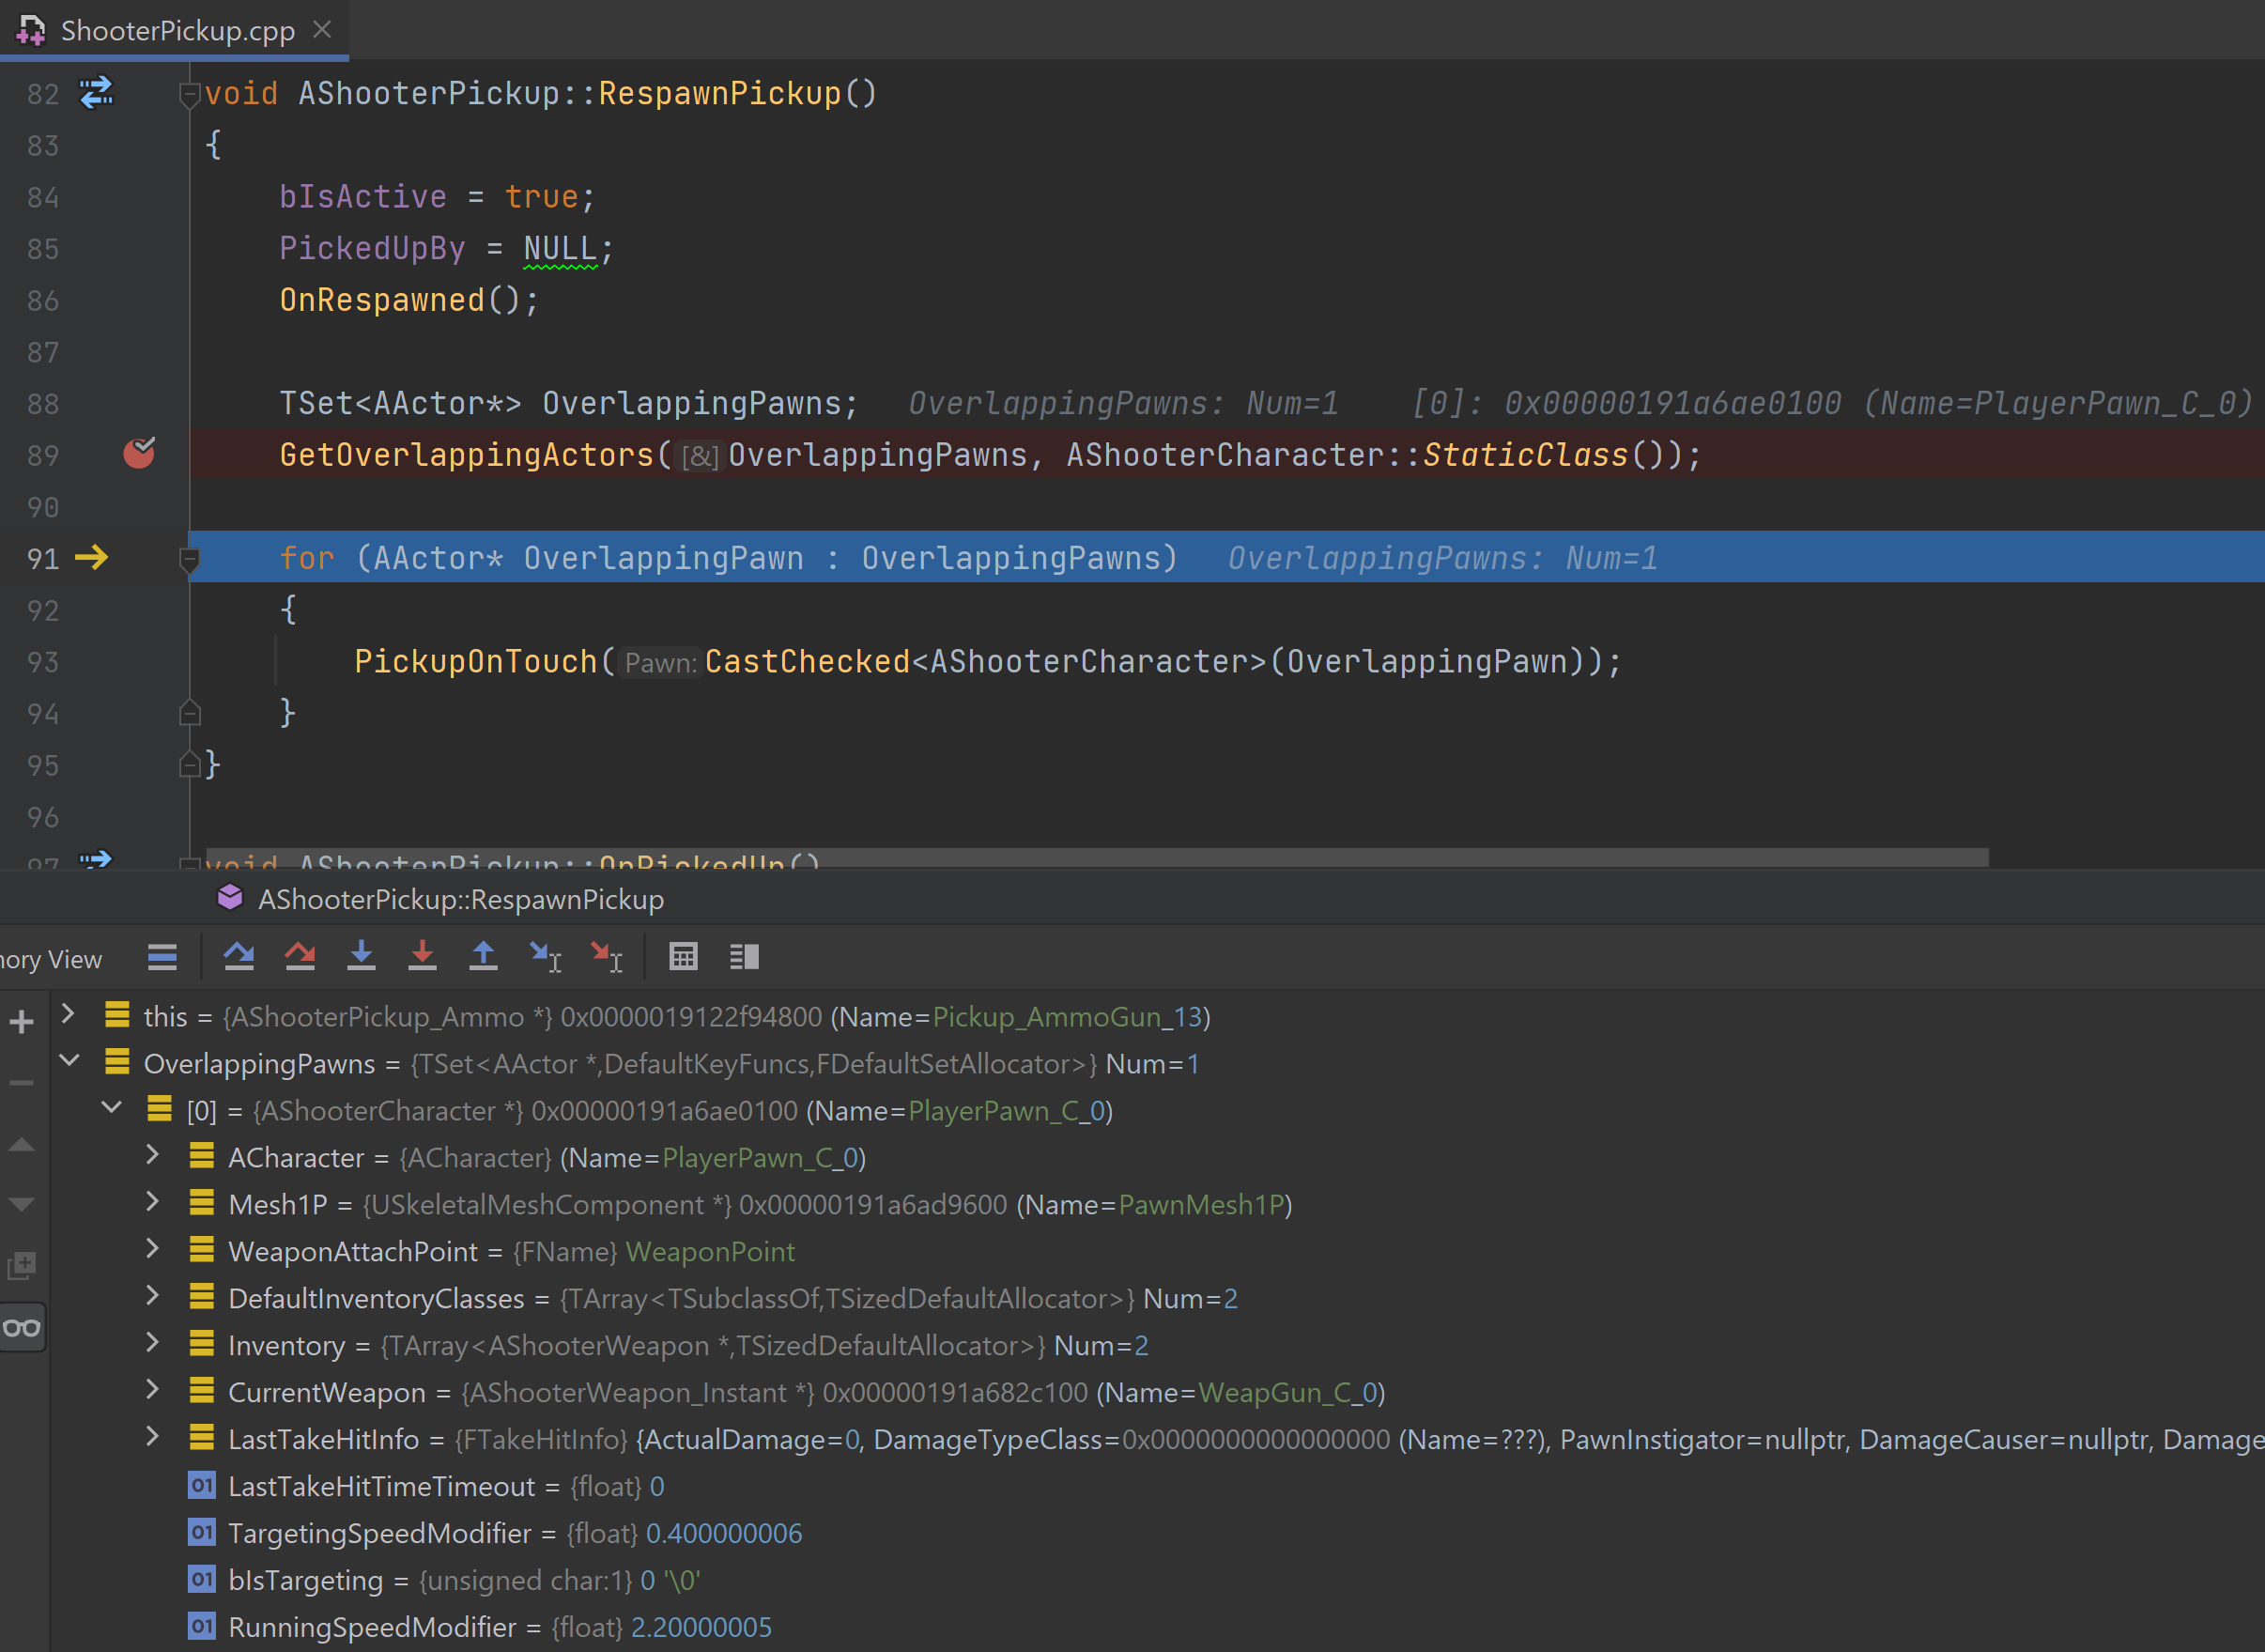
Built-in renderers:
JetBrains Rider automatically generates one-line summaries for all structures not covered by Natvis, and summaries are colored to increase readability.
JetBrains Rider shows the [Raw View] for Natvis-generated values.
Built-in formatters are enabled for wide/Unicode strings (
wchar_t,char16_t,char32_t).
Live Coding and Hot Reload
Live Coding is a system that can rebuild your application's C++ code and patch its binaries while the engine is running. JetBrains Rider supports invoking Live Coding (and also Hot Reload) right from the IDE, which means you can make changes to C++ classes, compile, and immediately see those changes take effect.
Hot Reload is a similar system of compiling new DLL files while the editor is open and loading them. Note that it is considered a legacy feature, and Live Coding is the preferred faster and more flexible option.
On Windows, Live Coding is enabled by default for all new Unreal Engine installations since version 5.0. When it is disabled, Unreal Editor falls back to using Hot Reload.
On macOS and Linux, Live Coding is currently not available, and Hot Reload is used instead.
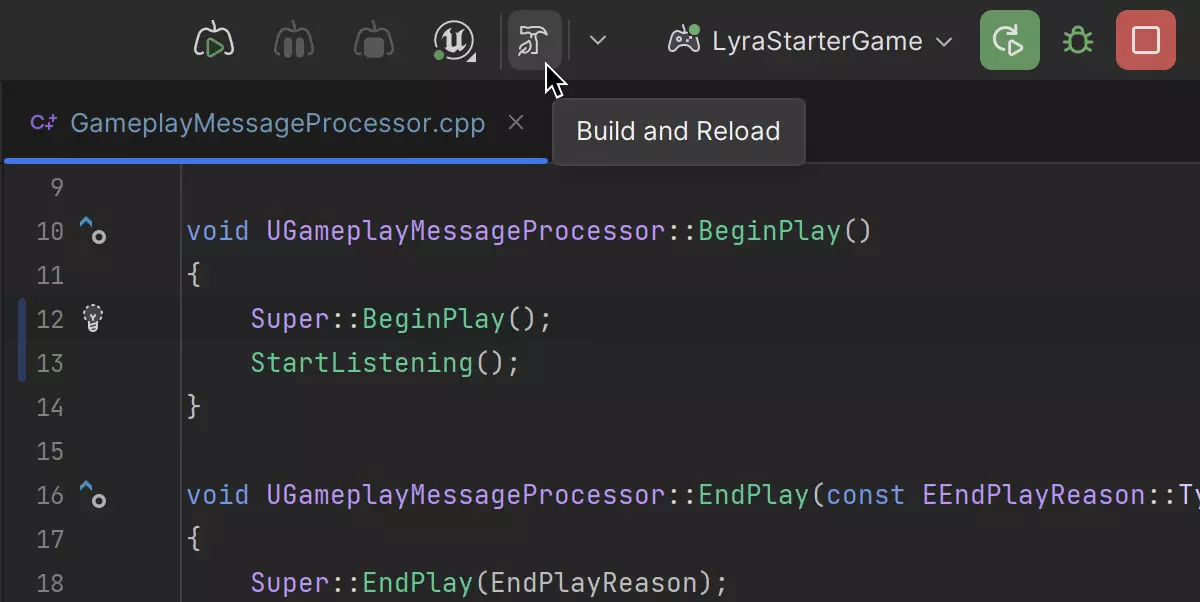
When Live Coding or Hot Reload is enabled in Unreal Editor, JetBrains Rider displays a Build and Reload toolbar button during debug process. Click this button to compile your changes and make Unreal Editor load the updates.
Watchpoints
Watchpoints (also referred as Data breakpoints) are helpful when you need to focus on a particular variable and its behaviour throughout the program execution. Whenever your program accesses the breakpoint being watched, JetBrains Rider will pause the execution or log to the console.
Set up a watchpoint
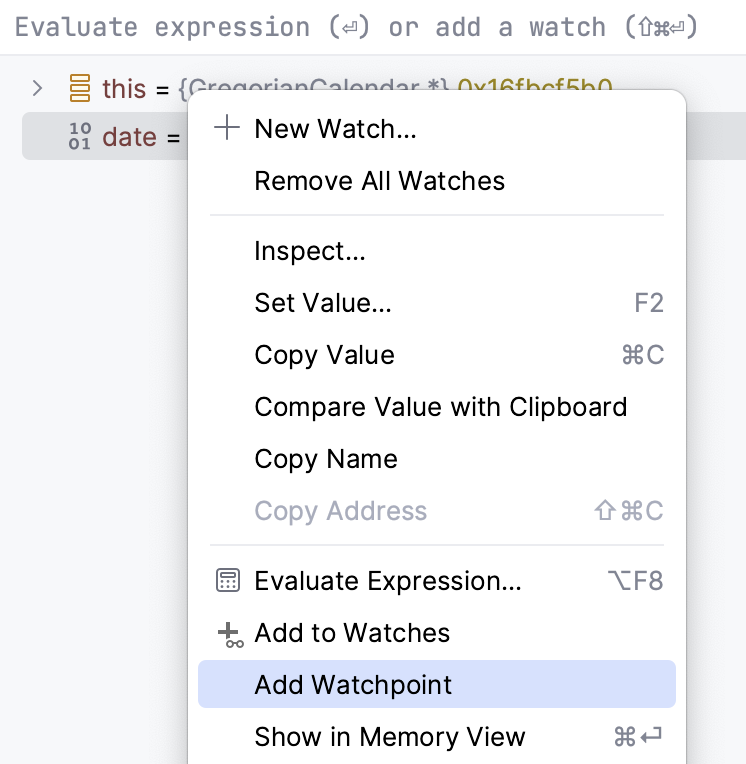
Pick a variable or expression, right-click it and choose Add Watchpoint:
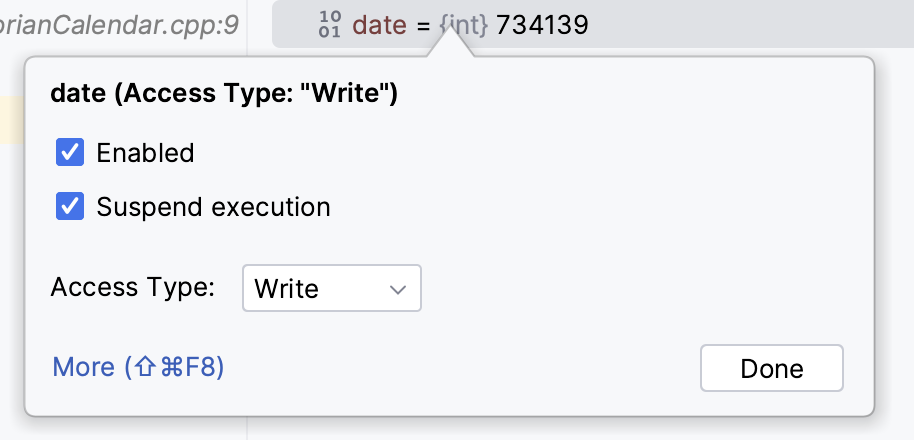
Configure the watchpoint in the popup:
To access additional properties, click More Ctrl+Shift+F8 or select from the main menu:
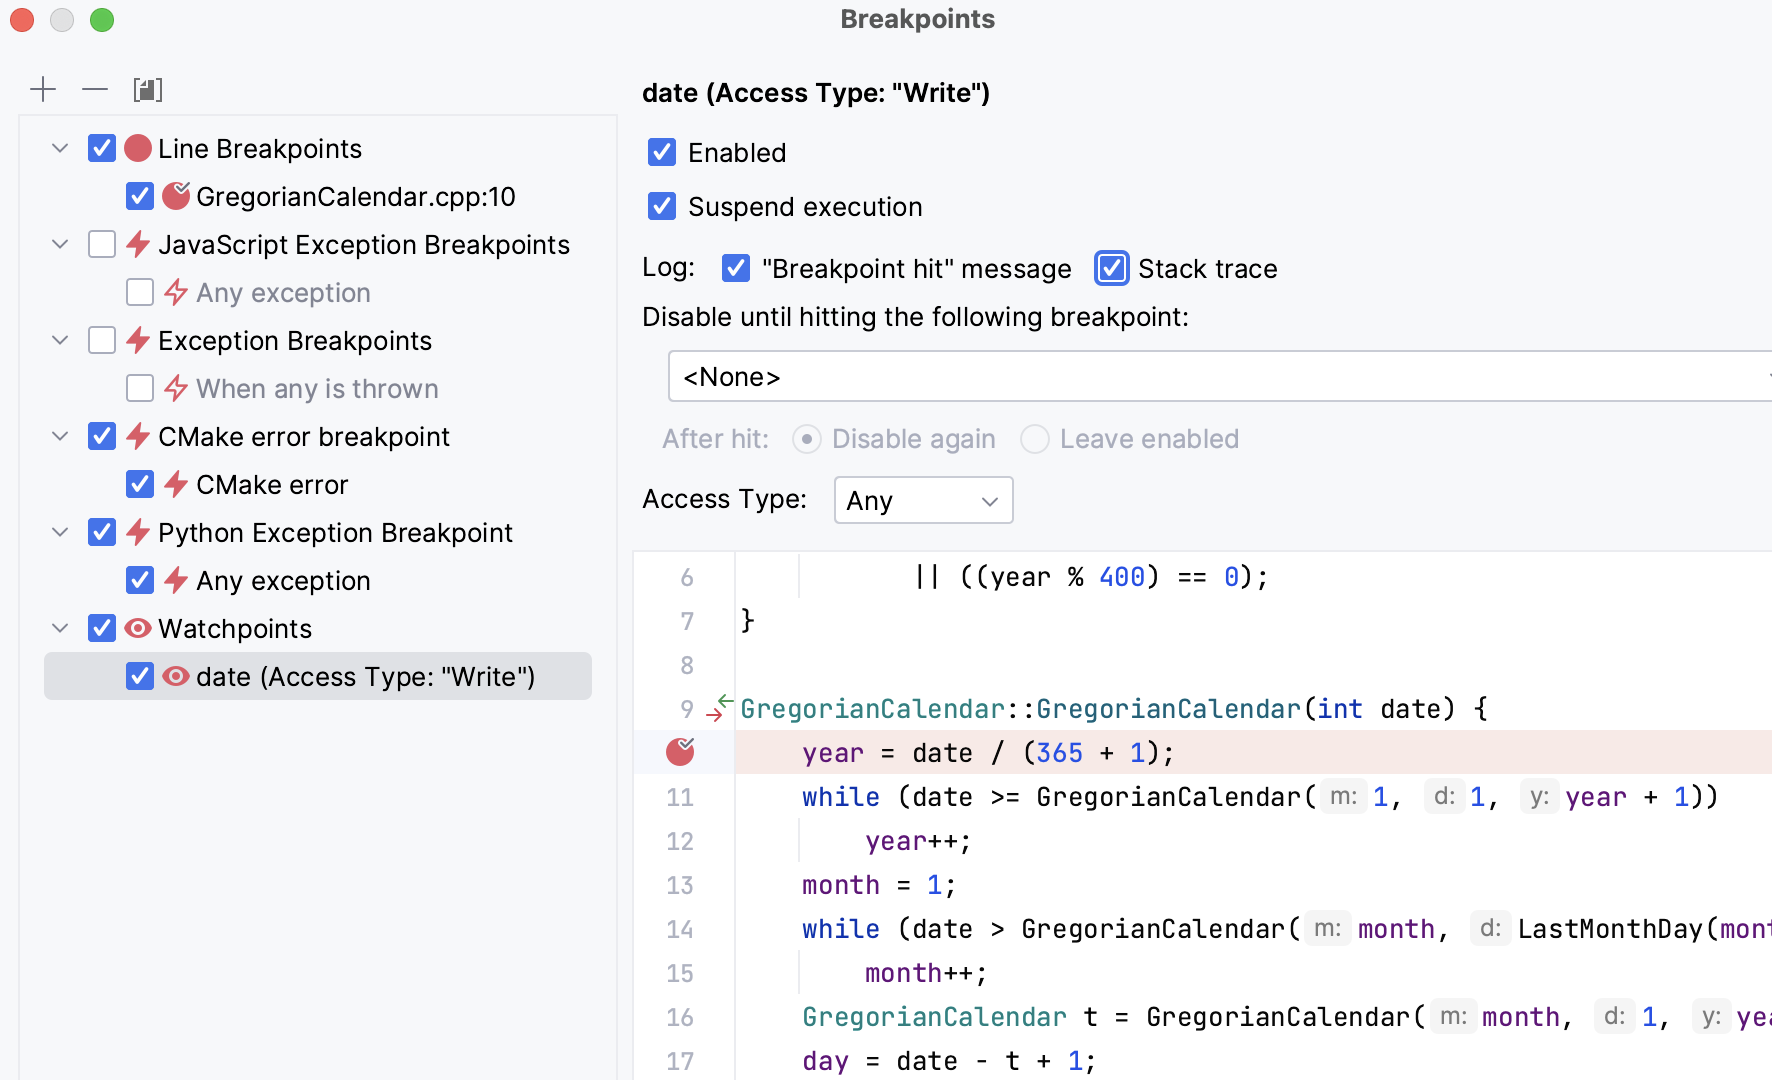
Option
Description
Enabled
Select or clear this checkbox to enable or disable the watchpoint.
Suspend execution
If this option is selected, the program's execution will stop at the event specified in the Access Type field. If you clear this checkbox, the program will not stop at the watchpoint hit, but any associated actions (e.g., logging) will still be performed.
Log
Select these checkboxes to log the Breakpoint hit message or the watchpoint's stack trace to console. This is useful if you want to analyze the changes of a variable without stopping the program's execution.
Disable until hitting the following breakpoint
This option disables the current watchpoint until some other breakpoint is encountered.
Access Type
Choose the type of access that will trigger the watchpoint: Read, Write, or Any.
Symbol servers on Windows
When debugging, sometimes the library symbols are not available on your local machine. In this case, you can use symbol servers.
The symbol server is a file server that stores your debug symbols centrally, on a server, rather than on each developer’s machine. Then, you can point your debugger to the symbol server to resolve symbol names. Everyone can share the same server.
In JetBrains Rider on Windows, you can point the debugger to the symbol server of your choice in :
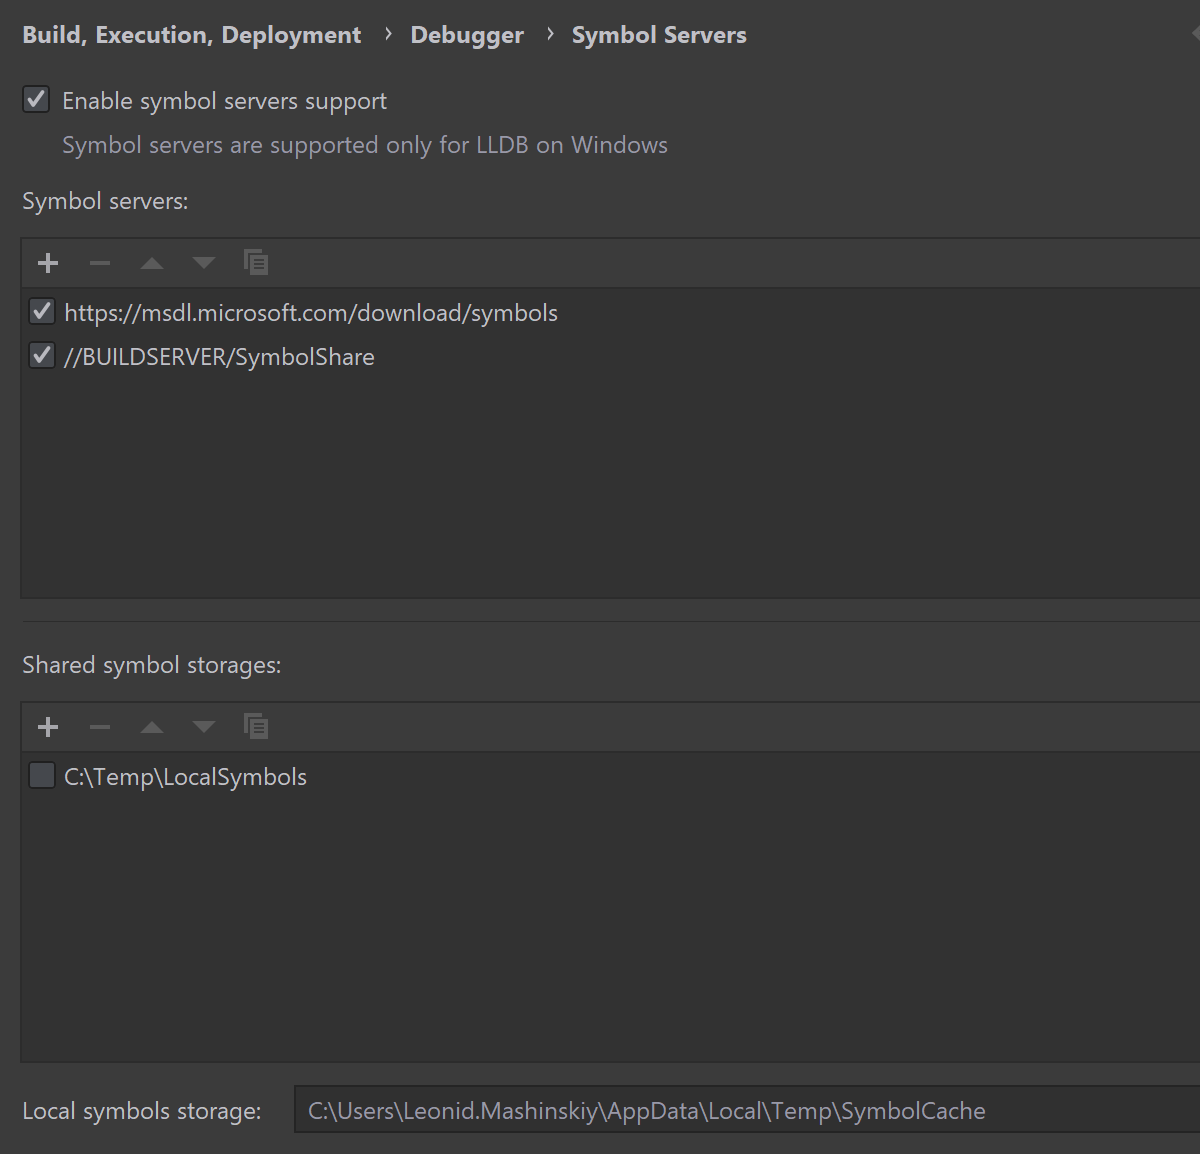
JetBrains Rider lets you configure symbol servers (or indexed storages) and non-indexed shared folders separately. If you need to add a public Microsoft symbol server, click the corresponding link.
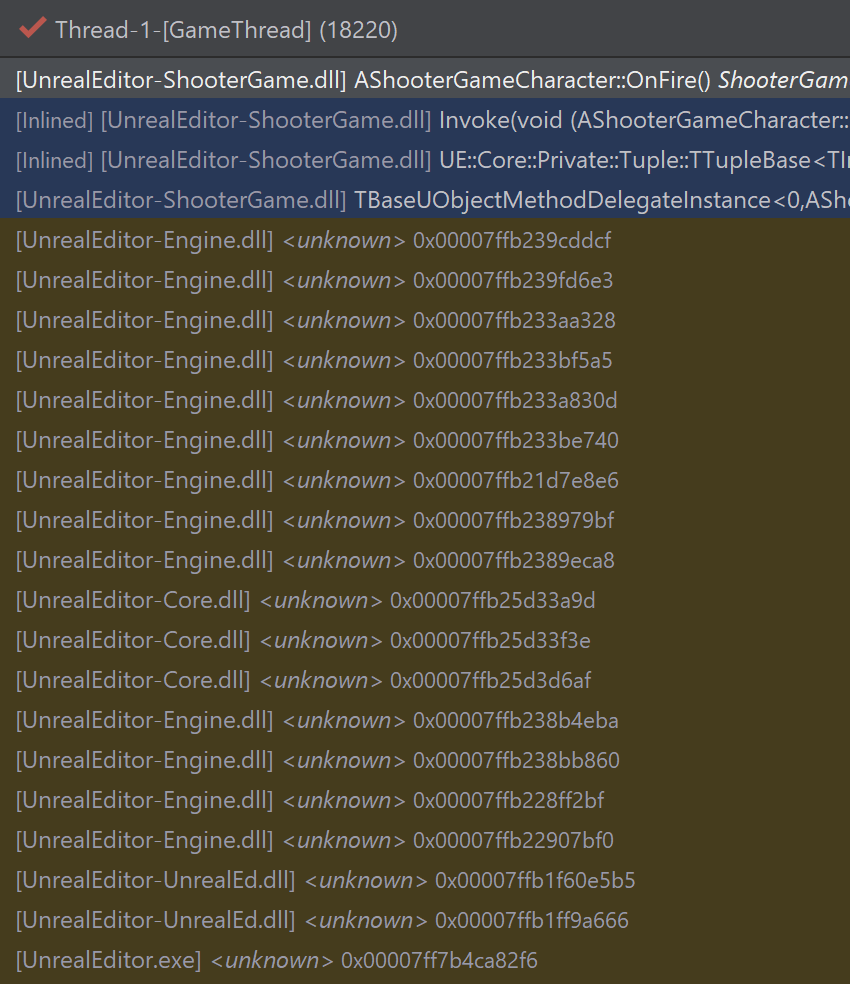
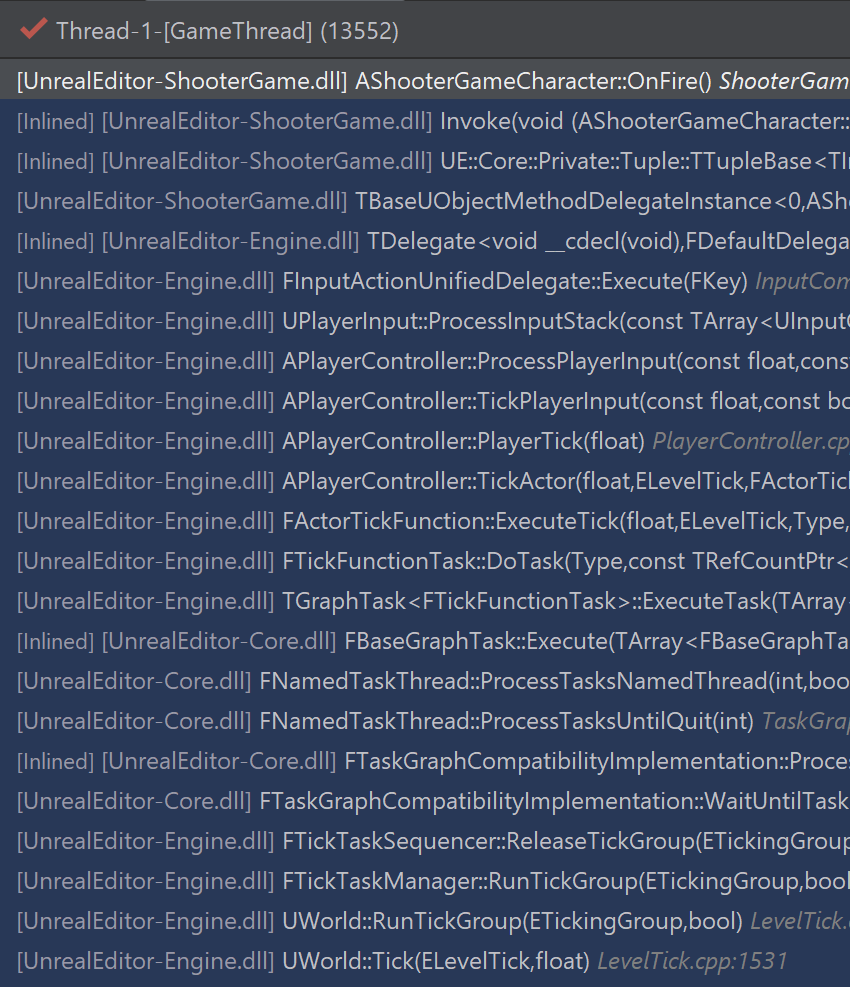
When configured for the first time, the download is triggered on the debugger session start. When the symbols are downloaded, library symbols will be correctly resolved. For example, frames from Windows system libraries will be shown.
Symbol server: OFF | Symbol server: ON |
|---|---|
 |  |
The Enable symbol servers support setting allows a debugger in JetBrains Rider to use any downloaded symbols cache locally. The directory of this cache is configurable in the settings.