Run tool window
The Run tool window displays output generated by your application. The appearance of each tab depends on the type of the application being run and can include additional toolboxes and panes.
Tool window tabs
Pin tabs
If you are running multiple applications, each one is displayed in a tab named after the run/debug configuration applied. To preserve the output of an application, even if you re-run it, pin the output tab.
Right-click the tab and select Pin Tab.
To pin tabs by default, press Ctrl+Alt+S to open the IDE settings, select Advanced Settings and enable the Make configurations pinned by default option.
Split tabs
RubyMine enables you to split the active Run tool window vertically or horizontally.
Right-click the desired tab in the tool window and select one of the split options: Split and Move Right or Split and Move Down.
Another way to do this is by dragging and dropping the desired tab. RubyMine highlights the available areas in the tool window where you can place the tab.
To unsplit the tool window, right-click the top pane and select Unsplit from the context menu.
Run toolbar
The main toolbar of the Run tool window lets you rerun, stop, pause, or terminate an application.
Item | Tooltip and shortcut | Description |
|---|---|---|
| Rerun Ctrl+F5 | Click this button to stop the current application and run it again. |
| Rerun automatically | Use this icon to enable the autotest-like runner: any test in the current run configuration restarts automatically after you change the related source code. For Maven projects, if you click this icon and change the source code (in your Java or POM files), the goal you are currently running, will rerun automatically after each change. |
| Stop Ctrl+F2 | Click this button to terminate the current process externally by means of the standard Clicking the button once invokes soft kill allowing the application to catch the |
| Pin Tab | Click this button to pin or unpin the current tab. You may need to pin a tab to prevent it from closing automatically when the maximum number of tabs is reached in this window. |
| Close Ctrl+Shift+F4 | Click this button to close the selected tab of the Run tool window and terminate the current process. |
Context menu options
Item | Description |
|---|---|
Compare with Clipboard | Opens the Clipboard vs Editor dialog that allows you to view the differences between the selection from the editor and the current clipboard content. This dialog is a regular comparing tool that enables you to copy the line at caret to the clipboard, find text, navigate between differences and manage white spaces. |
Fold Lines Like This | Opens the Console dialog that allows you defining the lines to be folded to hide extraneous information. |
Copy URL | Choose this command to copy the current URL to the system clipboard. This command only shows on a URL, if it is included in an application's output. |
Clear All | Clears the output window. |
Console toolbar
Item | Tooltip and shortcut | Description |
|---|---|---|
| Up/down the Stack Trace Ctrl+Alt+Up Ctrl+Alt+Down | Click this button to navigate up or down in the stack trace and have the caret jump to the corresponding location in the source code. |
| Use Soft Wraps | Click this button to toggle the soft wrap mode of the output. |
| Scroll to the end | Click this button to navigate to the bottom of the stack trace and have the caret jump to the corresponding location in the source code. |
| Click this button to send the console text to the default printer. | |
| Clear All | Click this button to remove all text from the console. This function is also available from the context menu of the console. |
| Show Ruby prompt | This button is available in the Debug console. If it is pressed, you can enter commands in the console and view output. Note that in the debug console, code completion is available: 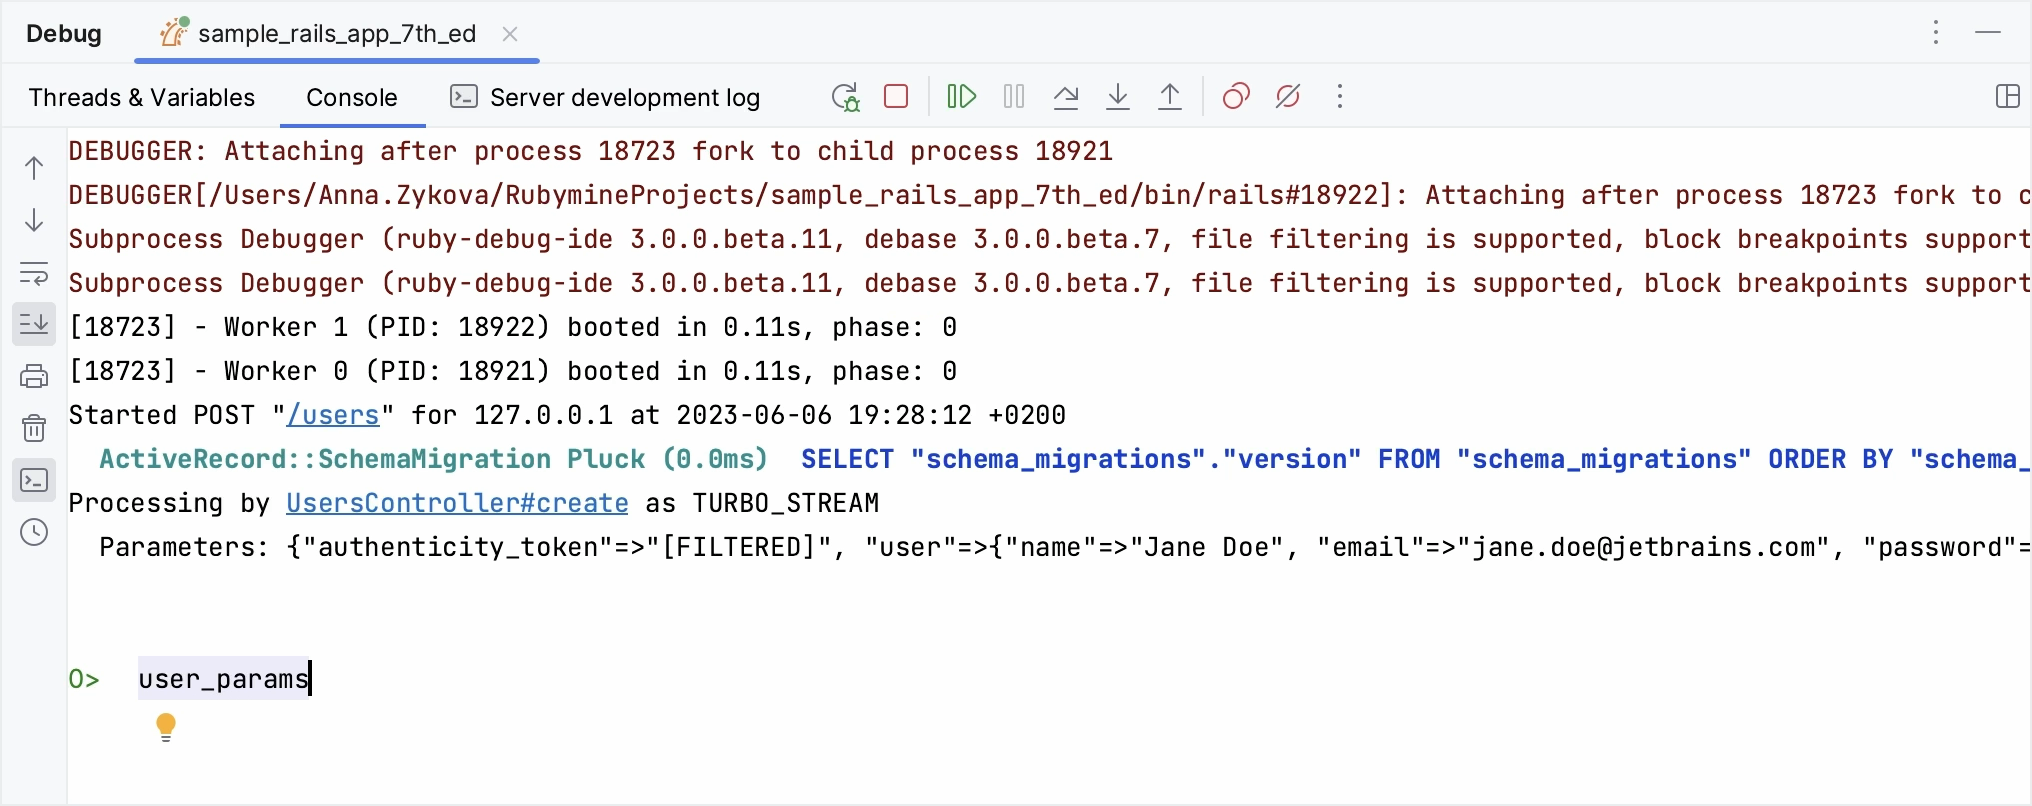 It's also possible to scroll through the history of commands with the up and down arrow keys. This button is not available while debugging tests. |
| Browse history Ctrl+Alt+E | Press this button to show the Debug Console History dialog, where one can view the console entries and navigate through them, using the arrow keys. Click OK to close the dialog. |