Inline Debugging
Basics
The inline debugging functionality facilitates the debugging procedure, as it lets you view the value of variables used in your source code right next to their usage, without having to switch to the Variables pane of the Debug tool window.
Enabling inline debugging
To enable the inline debugging functionality, do one of the following:
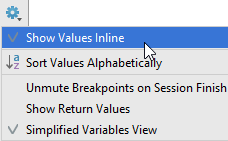
- In the Debug tool window toolbar, click the Settings icon
 and select the Show Values Inline option from the popup menu.
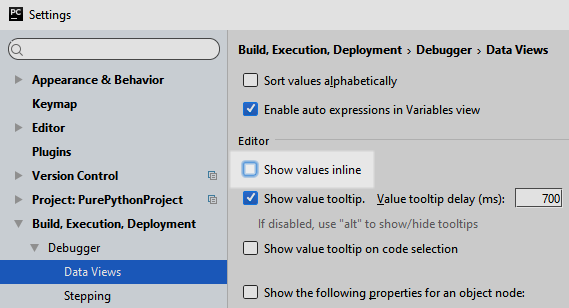
 - Open the Data Views page of Setting/Preferences dialog, and select the check box Show values inline.
Viewing inline debugging results
If this option is enabled, when you launch a debug session and step through the program, the values of variables are displayed at the end of the lines where these variables are used.

Turning inline debugging off
The inline variables view functionality is enabled by default. If needed, you can disable it in the following ways:
- In the Debug tool window toolbar, click the Settings icon
 and unselect the Show Values Inline option from the popup menu:
- Open the Data Views page of Setting/Preferences dialog, and unselect the check box Show values inline:

Last modified: 26 October 2017