Starting the Debugger Session
Before debugging
- Set breakpoints in the source code.
- If necessary, create or modify the corresponding Run/Debug configuration.
The debug session starts with the selected run/debug configuration. Note that several debug processes can be launched simultaneously.
For example, debugging session for a Ruby script will start with the default temporary run/debug configuration, unless you select a permanent one.
In case of a Rails application, RubyMine starts the debugging session with the pre-defined Rails run/debug configuration for the selected environment, for example .
Debugging an application
To start debugging a Ruby script
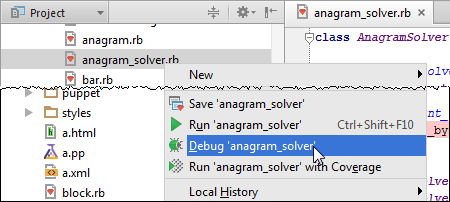
- Open the desired Ruby script in the editor, or select it in the Project tool window.
- On the context menu, choose :

Note that after you've launched a debug session, the ![]() icon that marks the Debug Tool Window toggles to
icon that marks the Debug Tool Window toggles to ![]() to indicate that the debugging process is active.
to indicate that the debugging process is active.
To start debugging a Rails application
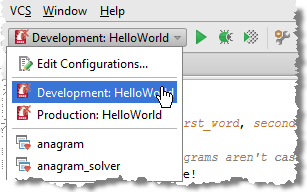
- Click the Select Run/Debug Configuration drop-down list, or press Shift+Alt+F9, and select .

- Do one of the following:
- If necessary, modify the selected run/debug configuration in Run/Debug Configuration:Rails. In particular, if you want to preview results in the browser, make sure that the Run browser check box is selected, and IP address specified. So doing, the application results will automatically display in your default Web browser defined in the Web Browsers page of the Settings dialog. Apply changes, and click Debug.
- If the run/debug configuration settings are defined in advance and the option Display settings before launching is not selected in the Run/Debug Configuration dialog box, launch the debugging session immediately. To do that, on the main menu choose , press Shift+F9, or click
 on the main toolbar.
Note that after you've launched a debug session, the ![]() icon that marks the Debug Tool Window toggles to
icon that marks the Debug Tool Window toggles to ![]() to indicate that the debugging process is active.
to indicate that the debugging process is active.