Creating and Editing Run/Debug Configurations
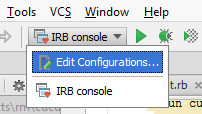
With the Navigation bar visible (), the available run/debug configurations are displayed in the run/debug configuration selector in the Run area:

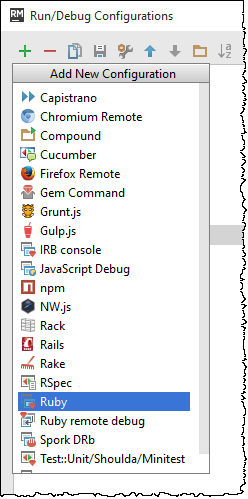
RubyMine provides the Run/Debug Configuration dialog box as a tool for handling run/debug configurations: create configuration profiles or change the default ones.
RubyMine suggests the following ways to create a run/debug configuration:
- Create a run configuration manually on the base of the default one, or using the Run/Debug Configuration dialog box.
- Save a temporary run configuration.
- Mind also the important note.
Also, the Run/Debug configuration can be deleted automatically for the deleted/obsolete targets, if this capability is enabled. See details here.
Note, that this capability is applicable only to those configurations that had being created automatically by CLion.
To create a run/debug configuration
- Open the Run/Debug Configuration dialog box by doing one of the following:
- On the main menu, choose .
- With the Navigation Bar visible (), choose from the selector of run/debug configurations.
- Press Shift+Alt+F10, then press 0 to display the Edit Configuration dialog box or select the configuration from the pop-up window and press F4.
- To invoke the Run/Debug Configuration dialog box for a Ruby script, Rake task, or a test template, press Shift+Alt+F10, then choose Create <name> on the context menu.
- In the Run/Debug Configuration dialog box, click
 on the toolbar or press Alt+Insert. The drop-down list shows the default run/debug configurations. Select the desired configuration type.
The fields that appear in the right pane display the default settings for the selected configuration type.
- For the new run/debug configuration:
- Specify its name in the Name text box. This name will be shown in the list of the available run/debug configurations.
- Specify whether you want to make RubyMine check execution status of the instances of the same run/debug configuration. If you want to make sure that only one instance of the run/debug configuration is currently executed, select the checkbox Single instance only. In this case, a confirmation dialog box will show up every time you try to launch run/debug configuration, when one instance of the same type is still running.
If you click OK in the confirmation dialog box, the first instance of the runner will be stopped, and the next one will take its place.
If this checkbox is not selected, you can launch as many instances of the runner as required. As the result, each runner will start in its own tab of the Run tool window.
- In the Before launch section, define whether you want to execute some tools or scripts prior to launching the run/debug configuration.
- Specify additional parameters depending on the configuration type. Refer to the descriptions of run/debug configuration parameters below the Run/Debug Configurations Dialog section.
- Apply the changes and close the dialog box.
To edit an existing run/debug configuration
- Do one of the following:
- From the main menu, choose .
- With the Navigation Bar visible (), choose from the run/debug configurations selector.
- PressShift+Alt+F10, then press 0 to display the Edit Configuration dialog box or select the configuration from the pop-up window and pressF4.
- In the corresponding run/debug configuration dialog box, change parameters as required.
Important note for multi-project usage
If a project has been created in an earlier version of RubyMine, its run/debug configurations can be lost, when such a project is added to another project, already opened in the same window.
To avoid the loss of run/debug configurations, it is recommended to open such a project once in the latest version, and only after being added to another project.
Managing multiple run configurations
You can manage multiple run configurations at once in a dedicated dashboard. For example, you start, pause and stop several applications, track their status, and examine application-specific details.
To enable the dashboard
- Click Edit Configurations from the run/debug configurations selector.
- Select Defaults from the list in the left-hand section.
- Under the Run Dashboard Types section, click
 and select the necessary run configuration type. You can add multiple configuration types one by one.
 - Apply the changes and close the dialog.
To show or hide the dashboard, go to and click Run dashboard.
If necessary, you can hide the tree section on the dashboard and view configurations on dashboard tabs. To do so, click the Show Configurations icon on the left toolbar on the Run dashboard, or press Ctrl+Shift+T.