Debugging
This section describes the procedures that are common for various types of applications.
RubyMine provides a full range of facilities for debugging your source code:
Breakpoints in Ruby (including the ERB and HAML files).
Breakpoints in JavaScript.
Multiple simultaneous debugging sessions.
Customizable breakpoint properties: conditions, pass count, and so on.
Runtime evaluation of expressions.
Prerequisites
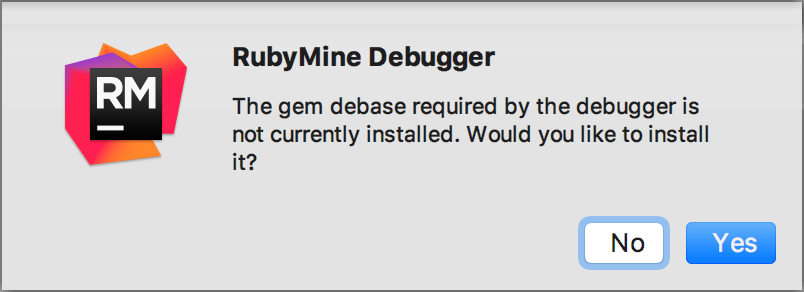
RubyMine requires the debase and ruby-debug-ide gems installed in the project SDK to debug Ruby 2.0+ projects. If these gems are not installed, RubyMine will suggest doing this when you run debugging for the first time.
Start a debugging session
Define a run/debug configuration for the application to be debugged.
Create a breakpoint.
Click the
 icon. Read more about debugging sessions in Starting the Debugger Session.
Breakpoints
Customize breakpoint settings
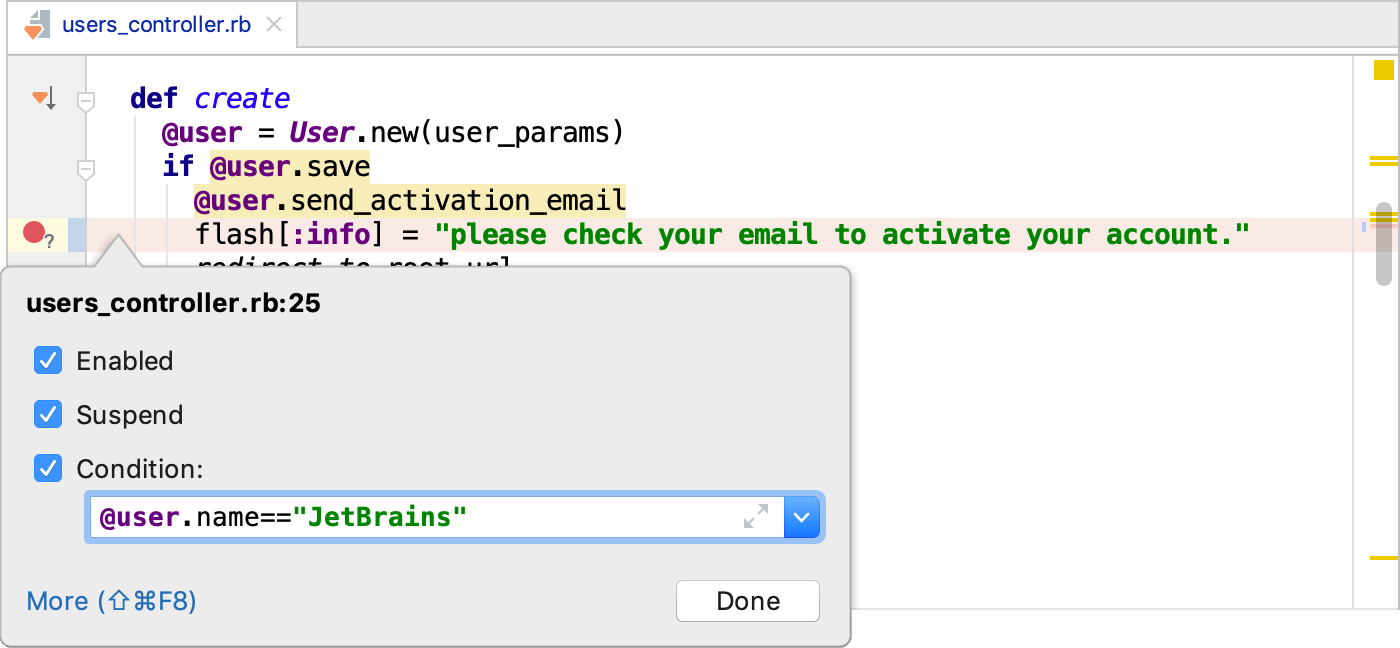
To customize breakpoint settings, press Ctrl+Shift+F8. To see all breakpoints in the project (with additional settings), click More or press the same shortcut Ctrl+Shift+F8 again.
Do not suspend code execution
Use action breakpoints to evaluate a variable at a particular line of code without suspending code execution. To create an action breakpoint, click the gutter while pressing Shift.
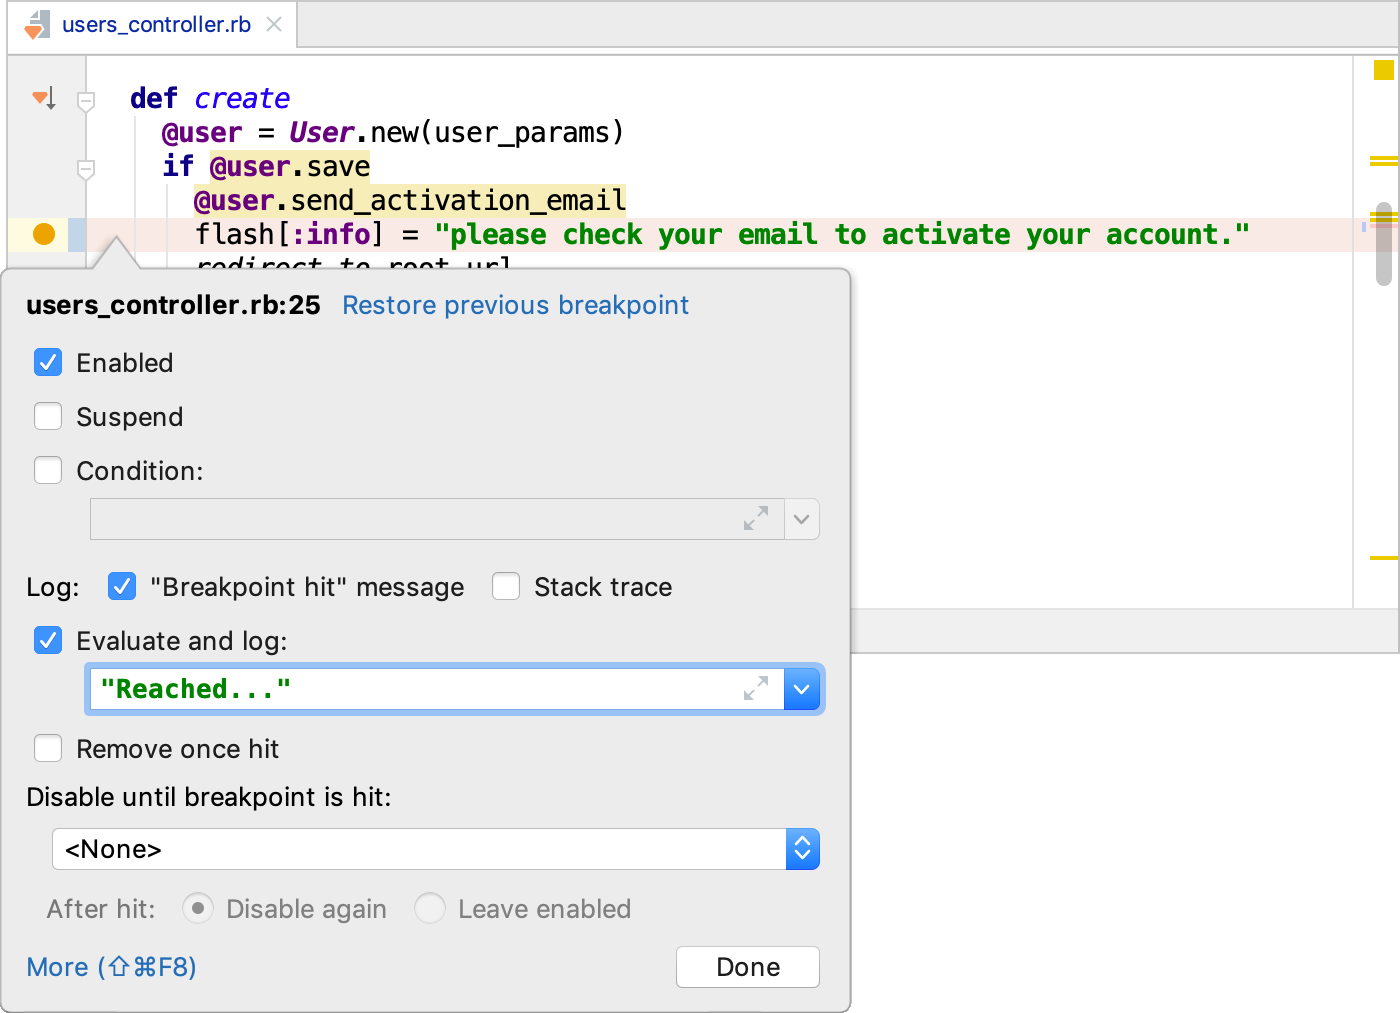
Create a temporary breakpoint
To create a breakpoint that stops only once, click the left gutter while holding Shift+Alt. For more information, refer to the section Breakpoints.
Disable breakpoints
To disable a breakpoint, click the breakpoint while pressing Alt. Refer to the section Breakpoints for details.
Debugger session
Run to cursor
Create a breakpoint.
Run a debugging session. To run a debugging session, click the Run Application icon (
 ) in the gutter area and select Debug <configuration_name>.
To stop code execution at the cursor position without adding another breakpoint, click the Run to cursor icon (![]() ) or press Alt+F9. Alternatively, you can click the line number in the gutter area.
) or press Alt+F9. Alternatively, you can click the line number in the gutter area.
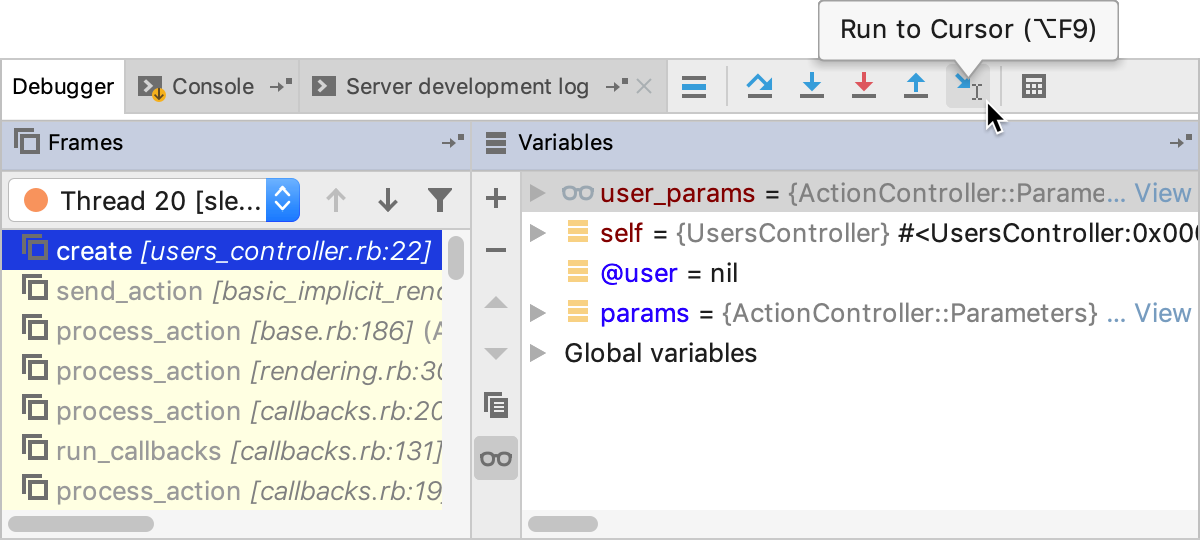
The icon ![]() is described in the toolbar reference of the Debug tool window.
is described in the toolbar reference of the Debug tool window.
Evaluate expression
While in debug mode, you can evaluate any expression by pressing Alt+F8.
This tool provides code completion just as in the editor so it’s very easy to enter any expression:
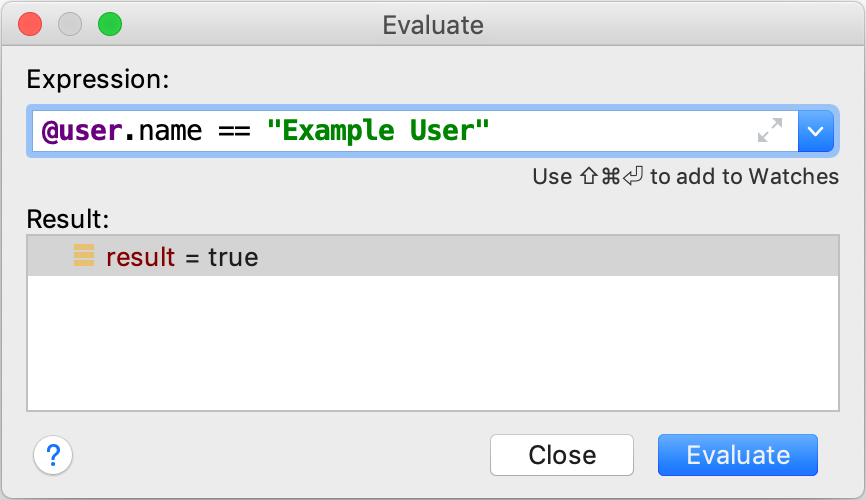
Refer to the section Evaluating Expressions for details.
Remote debug
The final thing you definitely should know about debugging in RubyMine is Remote debug. Remote debug means attaching debugger to a process which is already running on a specific port on your or any other’s host. This way you can attach the debugger to your application server which is running standalone.
To create a remote configuration, go to Edit configurations and add Remote run configuration. Make sure to specify the correct host and port before you run this configuration.
Settings
Configuring debugger settings
To change debugger settings, click . In the Settings menu, click .
Useful debugger shortcuts
Action | Hotkey |
|---|---|
| Toggle breakpoint | Ctrl+F8 |
| Resume program | F9 |
| Step over | F8 |
| Step into | F7 |
Stop | Ctrl+F2 |
| View breakpoint details/all breakpoints | Ctrl+Shift+F8 |
Debug code at caret | Shift+F9 (within the main method), or Shift+Alt+F9 |