Get results and fix problems
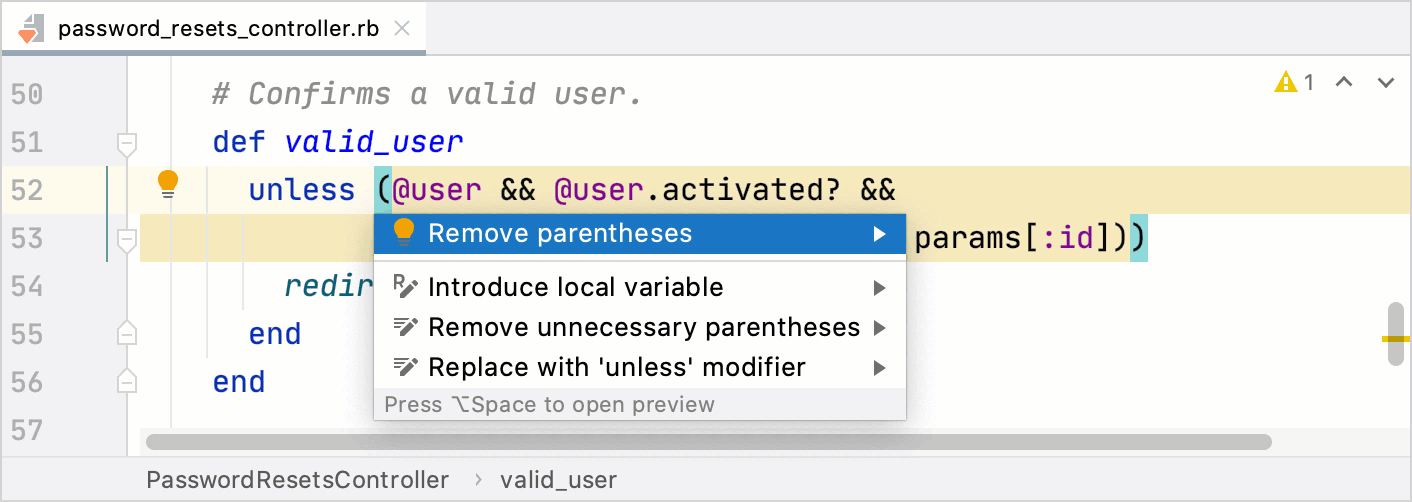
If an inspection has detected a problem in your code, you can quickly apply a fix in the editor. Place the caret at the highlighted piece of code and press Alt+Enter.
For some inspections, you can open a preview by pressing Ctrl+Q ().

Apply fixes in the Problems tool window
If you have invoked inspections manually, you can examine the results in the Problems tool window that opens automatically after the analysis is finished. All detected problems are listed in the left part of the tool window. Click a problem to display inspection details on the right.
To fix a problem, click the
 icon on the toolbar or in the context menu. You can also press Alt+Enter and select a suitable fix from the popup menu.

Clean up your code
You can streamline the process of fixing problems in your code by running Code Cleanup. This allows you to batch-apply quick-fixes to the selected scope without examining each problem individually.
During the cleanup, the IDE applies fixes from the code cleanup inspections in the selected inspection profile. To view the list of these inspections, open the Settings/Preferences dialog by pressing Ctrl+Alt+S and go to , click ![]() , and enable the Show only cleanup inspections option.
, and enable the Show only cleanup inspections option.
Batch-apply quick-fixes (Code Cleanup)
From the main menu, select .
In the Specify Code Cleanup Scope dialog, select the scope to which you want to apply a profile.
Select the inspection profile from the Inspection profile list, or click Configure to create a new profile.
You can also click Configure to view all code cleanup inspections and their settings.
Click OK to launch the cleanup.

RubyMine performs code analysis and applies quick-fixes from the selected inspection profile to the detected issues.
Alternatively, you can place the caret at an error in the source code that corresponds to a quick-fix, click the red bulb ![]() (suggested quick-fix) that appears on the left, and select Code Cleanup from the menu.
(suggested quick-fix) that appears on the left, and select Code Cleanup from the menu.
The Specify Code Cleanup Scope dialog
Item | Description |
|---|---|
Whole project | Select this option if you want to perform code cleanup for the whole project. |
Uncommitted files | This option is only available for projects under version control. Clean up the code in the files that have not yet been committed to a version control system. You can select a changelist of fix problems in all uncommitted files. |
File <file path> | Select this option to perform code cleanup for the file that is open in the editor or selected in the Project tool window. |
Module <module name> | Select this option to perform code cleanup for the project that is currently selected in the Project tool window. This option is only available, when several projects are opened in one RubyMine window your . |
Directory <directory path> | Clean up the code in the directory that is currently selected in the Project tool window. |
Selected files | Clean up the code in the files selected in the Project tool window. |
Custom scope | Select a scope custom scope. You can select one of the predefined scopes from the list, or click |
Include test sources | Apply the code cleanup to test sources. |
Inspection profile | Select an inspection profile. You can use a pre-defined profile from the list, or click Configure and create a new profile in the Inspections dialog that opens. You can open the Inspections dialog to check which fixes will be applied to the selected scope when you run code cleanup. |
Run Silent Cleanup
You can also run the code cleanup in the silent mode without displaying the Specify Code Cleanup Scope dialog. In this case, the IDE runs the cleanup inspections from the profile that is currently configured in the settings.
Select the node in which you want to clean up your code in the Project tool window Alt+1.
Otherwise, the cleanup will run in the file that is currently opened in the editor.
From the main menu, select .
Clean up your code before committing it to Git
You can clean up your code in files before they are committed to Git. In this case, the current inspection profile will be applied.
Press Ctrl+K or select from the main menu.
In the Commit tool window, click
 and in the Before Commit area, select the Cleanup checkbox.
Click Configure and select the required inspection profile from which the IDE will run inspections.
Click Commit.
Automatically clean up your code on save
You can configure the IDE to clean up your code in modified files automatically when your changes are saved.
Press Ctrl+Alt+S to open the IDE settings and select .
Enable the Run code cleanup option.
Additionally, you can click Configure inspections to specify the inspection profile from which the IDE will run code cleanup inspections.
Export results
After you run inspections, results are displayed on a dedicated tab of the Problems tool window. You can export them to one of the available formats.
In the Problems tool window ( or Alt+6), switch to the tab that contains inspection results that you want to export and click
 .
. 
Select the format in which you want to save the report (HTML or XML) and the target directory, and click Save.