# Debug Rails and JavaScript together
> For the complete documentation index, see [llms.txt](https://www.jetbrains.com/help/ruby/2026.3/llms.txt).
RubyMine can hit Ruby and JavaScript breakpoints in the same debug run: you enable the JavaScript debugger in the Rails run/debug configuration, and starting it debugs the server and the browser at once.
> **Note:**
> JavaScript breakpoints require source maps, so the application must build its JavaScript with a bundler — esbuild, Rollup, webpack, or Vite. Applications served through `importmap-rails` have no build step, no source maps, and their breakpoints are never hit.
## Create a sample application with esbuild
To see the feature in a concrete case, build a minimal application first: a page with a button, and a JavaScript handler that reacts to a click. It takes a few minutes, and it gives you a JavaScript file you can actually stop in.
Create a project and make sure to select esbuild from the build tool list.
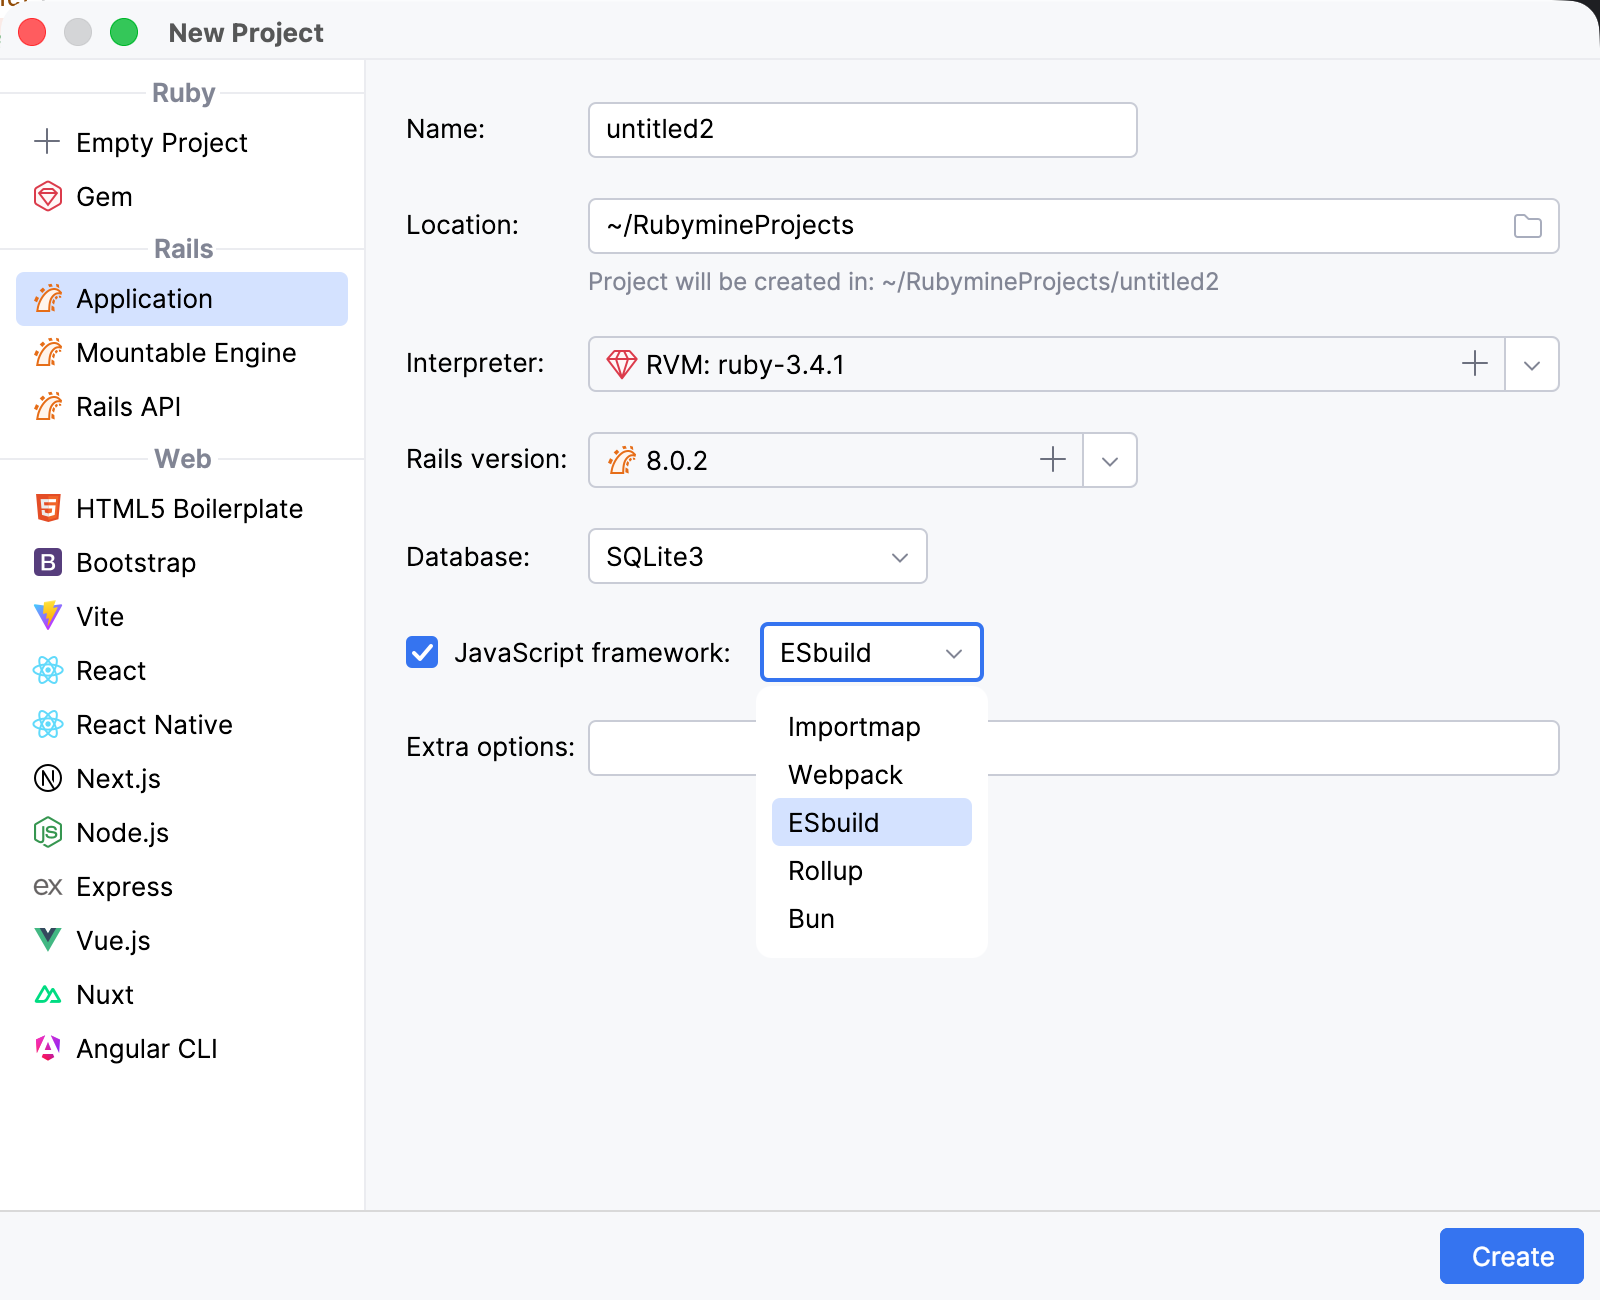
Once the project is created, perform the procedures below.
Procedure: Add a controller
1. Press `Ctrl` (Windows), `Ctrl` (macOS), `Ctrl` (IntelliJ IDEA Classic (macOS)), `Ctrl` (macOS System Shortcuts), `Ctrl` (XWin), `Ctrl` (GNOME), `Ctrl` (KDE), `Ctrl` (Emacs), `Ctrl` (Sublime Text), `Ctrl` (Sublime Text (macOS)), `Ctrl` (Visual Studio), `Ctrl` (Visual Studio (macOS)), `Ctrl` (TextMate), `Ctrl` (NetBeans), `Ctrl` (Eclipse), `Ctrl` (Eclipse (macOS)) twice and start typing controller. Select rails generate controller and press `Enter` (Windows), `⏎` (macOS), `⏎` (IntelliJ IDEA Classic (macOS)), `⏎` (macOS System Shortcuts), `Enter` (XWin), `Enter` (GNOME), `Enter` (KDE), `Enter` (Emacs), `Enter` (Sublime Text), `⏎` (Sublime Text (macOS)), `Enter` (Visual Studio), `⏎` (Visual Studio (macOS)), `Enter` (TextMate), `Enter` (NetBeans), `Enter` (Eclipse), `⏎` (Eclipse (macOS)).
2. In the Add New Controller dialog, set the controller name to Welcome and add an action named index. Click OK.
3. Open `config/routes.rb` and add the following line inside the `Rails.application.routes.draw do ... end` block:
```RUBY
root "welcome#index"
```
Procedure: Update a view
Add a button to the generated view.
1. In the Project view (`Alt+1` (Windows), `⌘ 1` (macOS), `⌘ 1` (IntelliJ IDEA Classic (macOS)), `⌘ 1` (macOS System Shortcuts), `Alt+1` (XWin), `Alt+1` (GNOME), `Alt+1` (KDE), `Alt+1` (Emacs), `Alt+1` (Sublime Text), `⌘ 1` (Sublime Text (macOS)), `Ctrl+Alt+L` (Visual Studio), `⌘ ⌥ L` (Visual Studio (macOS)), `Meta+1` (TextMate), `Ctrl+1` (NetBeans), `Alt+1` (Eclipse), `Alt+1` (Eclipse (macOS))), open `app/views/welcome/index.html.erb`.
2. Replace the contents of the file with the following code:
```ERB
Hello, Rails!
```
The button has an identifier that the JavaScript handler will use.
Procedure: Add a JavaScript handler
Create a JavaScript file that handles the button click.
1. In the Project view, select the `app/javascript` directory.
2. Press `Alt+Insert` (Windows), `⌘ N` (macOS), `⌃ N` (IntelliJ IDEA Classic (macOS)), `⌘ N` (macOS System Shortcuts), `Alt+Insert` (XWin), `Alt+Insert` (GNOME), `Alt+Insert` (KDE), `Alt+Insert` (Emacs), `Ctrl+N` (Sublime Text), `⌘ N` (Sublime Text (macOS)), `Ctrl+N` (Visual Studio), `⌘ N` (Visual Studio (macOS)), `Meta+Shift+N` (TextMate), `Alt+Insert` (NetBeans), `Alt+Insert` (Eclipse), `⌘ N` (Eclipse (macOS)) and select JavaScript File.
3. Enter hello as the file name and press `Enter` (Windows), `⏎` (macOS), `⏎` (IntelliJ IDEA Classic (macOS)), `⏎` (macOS System Shortcuts), `Enter` (XWin), `Enter` (GNOME), `Enter` (KDE), `Enter` (Emacs), `Enter` (Sublime Text), `⏎` (Sublime Text (macOS)), `Enter` (Visual Studio), `⏎` (Visual Studio (macOS)), `Enter` (TextMate), `Enter` (NetBeans), `Enter` (Eclipse), `⏎` (Eclipse (macOS)).
4. Add the following code to `hello.js`:
```JAVASCRIPT
const button = document.getElementById("greet-user-button")
if (button) {
button.addEventListener("click", () => {
alert("Hello, JavaScript!")
})
}
```
This script finds the button and attaches a click handler to it.
5. Open `app/javascript/application.js` and add the following import, keeping the imports generated by Rails:
```JAVASCRIPT
import "./hello"
```
6. Open `app/views/layouts/application.html.erb` and verify that it loads the generated application bundle:
```ERB
<%= javascript_include_tag "application",
"data-turbo-track": "reload",
type: "module" %>
```
Procedure: Build the JavaScript bundle
1. In the Project view, open `package.json`.
2. Verify that the `scripts` section contains the following build command:
```JSON
{
"scripts": {
"build": "esbuild app/javascript/*.* --bundle --sourcemap --format=esm --outdir=app/assets/builds --public-path=/assets"
}
}
```
The `--sourcemap` option is what makes the breakpoints in `hello.js` work: it generates the source maps that connect the bundle running in the browser back to your original files.
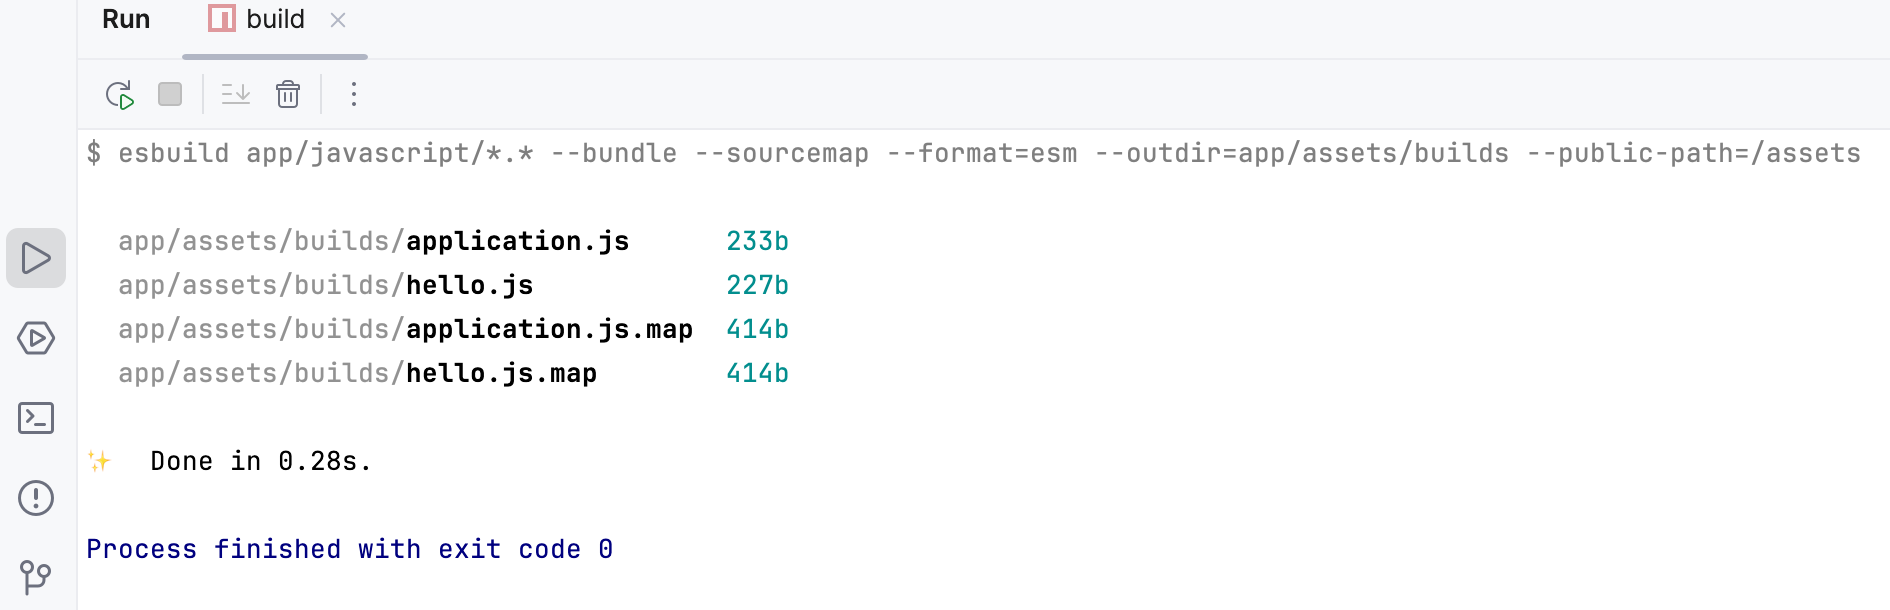
3. Click the Run icon in the gutter next to the `build` script and select Run 'build'.
RubyMine runs `yarn build` and displays the result in the Run tool window.
## Enable the JavaScript debugger
To debug JavaScript, enable automatic startup of the JavaScript debugger in the [run/debug configuration](run-debug-configuration.html) of your application.
Procedure:
1. Go to `Run | Edit Configurations` and select the automatically created development configuration in the Rails group.
2. Specify the following options:
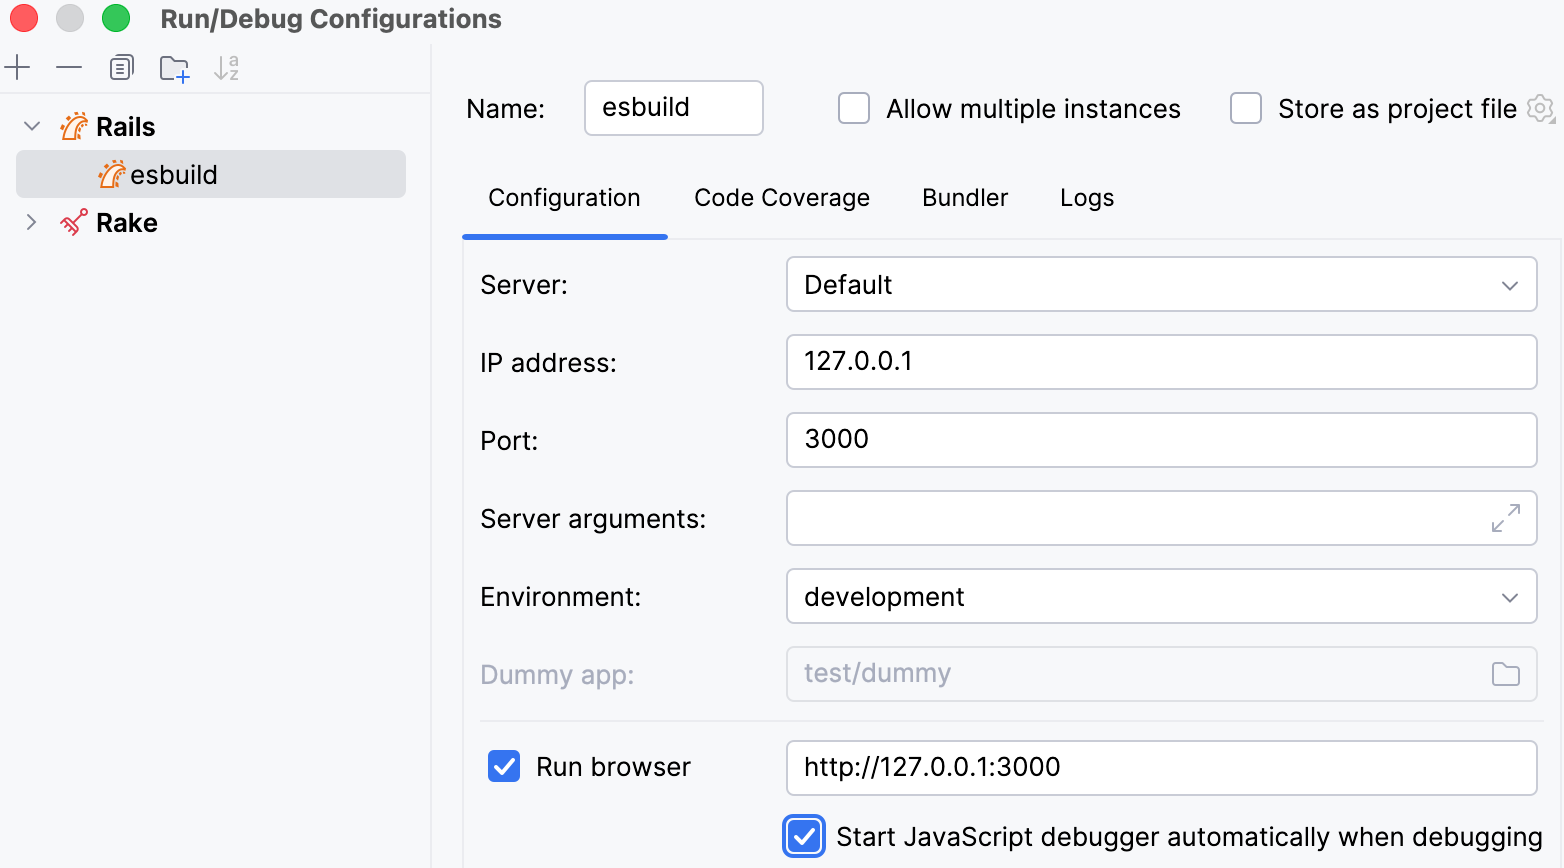
* Enable the Run browser option and specify `http://127.0.0.1:3000`. This URL opens the `app/views/welcome/index.html.erb` view that uses the JavaScript asset.
* Enable Start JavaScript debugger automatically when debugging.
## Start debugging
To debug the JavaScript code, follow the steps below:
Procedure:
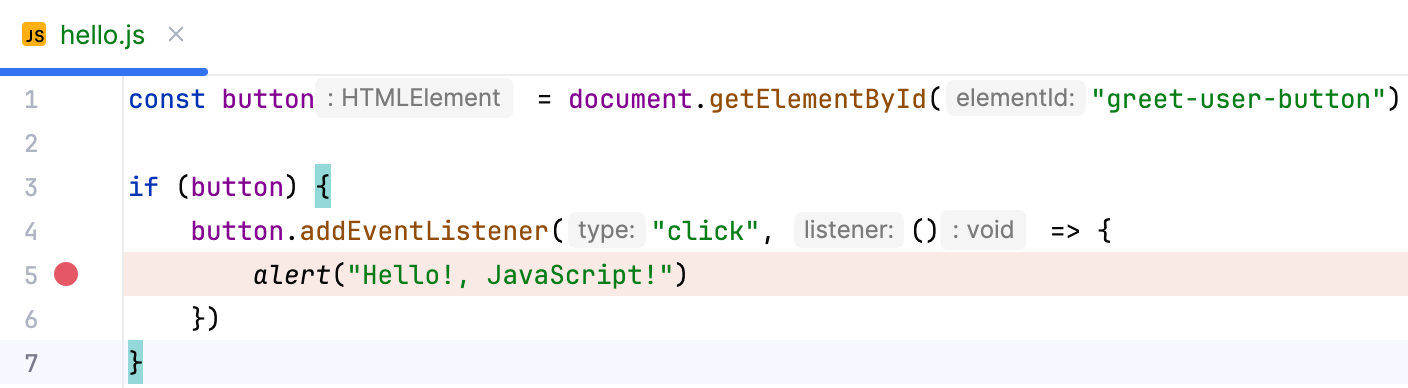
1. Open `app/javascript/hello.js` and set a breakpoint on the line that calls `alert`.
2. To start debugging, press `Ctrl` (Windows), `Ctrl` (macOS), `Ctrl` (IntelliJ IDEA Classic (macOS)), `Ctrl` (macOS System Shortcuts), `Ctrl` (XWin), `Ctrl` (GNOME), `Ctrl` (KDE), `Ctrl` (Emacs), `Ctrl` (Sublime Text), `Ctrl` (Sublime Text (macOS)), `Ctrl` (Visual Studio), `Ctrl` (Visual Studio (macOS)), `Ctrl` (TextMate), `Ctrl` (NetBeans), `Ctrl` (Eclipse), `Ctrl` (Eclipse (macOS)) twice and start typing the name of the Development configuration. Select the configuration, press and hold `Shift` (Windows), `Shift` (macOS), `Shift` (IntelliJ IDEA Classic (macOS)), `Shift` (macOS System Shortcuts), `Shift` (XWin), `Shift` (GNOME), `Shift` (KDE), `Shift` (Emacs), `Shift` (Sublime Text), `Shift` (Sublime Text (macOS)), `Shift` (Visual Studio), `Shift` (Visual Studio (macOS)), `Shift` (TextMate), `Shift` (NetBeans), `Shift` (Eclipse), `Shift` (Eclipse (macOS)) (the dialog title changes to Debug), and press `Enter` (Windows), `⏎` (macOS), `⏎` (IntelliJ IDEA Classic (macOS)), `⏎` (macOS System Shortcuts), `Enter` (XWin), `Enter` (GNOME), `Enter` (KDE), `Enter` (Emacs), `Enter` (Sublime Text), `⏎` (Sublime Text (macOS)), `Enter` (Visual Studio), `⏎` (Visual Studio (macOS)), `Enter` (TextMate), `Enter` (NetBeans), `Enter` (Eclipse), `⏎` (Eclipse (macOS)).
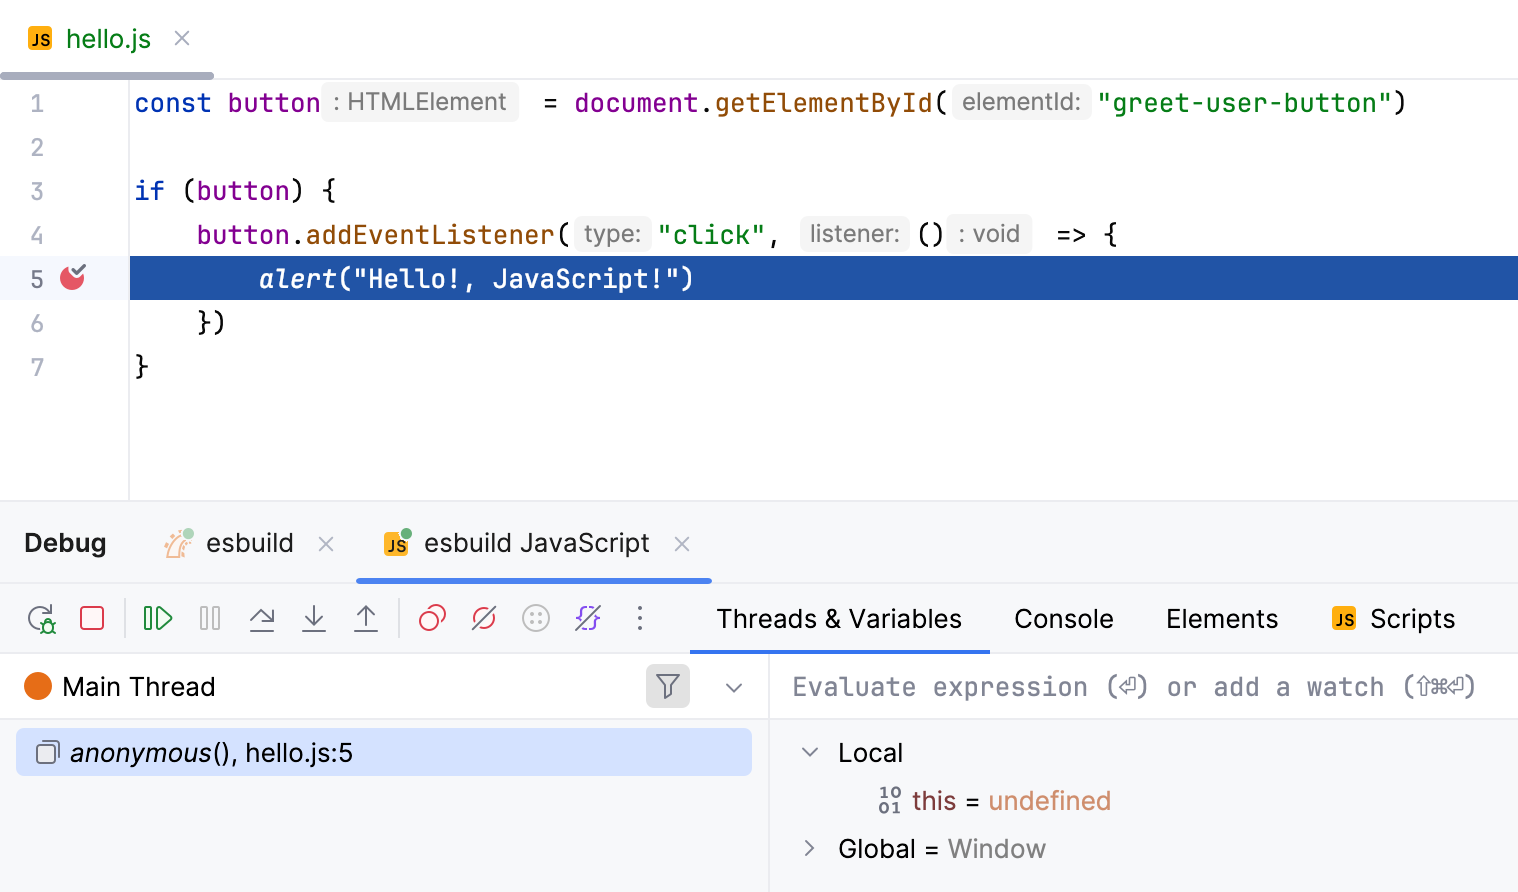
3. On the opened `http://127.0.0.1:3000` page, click Hello!. The debugger pauses at the breakpoint and enables you to examine the application state. To learn more, refer to [Debug JavaScript in Chrome](debugging-javascript-in-chrome.html).
> **Tip:**
> In the image above, RubyMine has started two debug sessions: one for the Rails code and one for the JavaScript. Both are live, so you can switch between them and set breakpoints on either side without restarting anything.
> **Note:**
> If a breakpoint appears hollow and is not hit:
>
>
>
> * Re-run the `build` script. The run configuration starts the server but does not rebuild JavaScript, so the browser may still be running the previous bundle.
>
> * Reload the page. Code at the top level of a module can run before the JavaScript debug session attaches. Breakpoints inside event handlers, like the one in this tutorial, are not affected.