Profile applications
RubyMine provides the ability to profile running Ruby/Rails processes using the rbspy sampling profiler. The profiler collects information about the execution of your application. You can run Ruby/Rails applications with the attached profiler, or you can attach the profiler to the already running processes. After you stop the profiling session, you can analyze how much time is spent on each method/block and determine performance issues.
In this topic, we’ll show you how to run/stop the profiling session and analyze results.
Prerequisites
Before starting a profiling session, install the rbspy profiler for your platform using this instruction: Installing rbspy. After that, you will be able to profile applications with local Ruby MRI interpreters from the 1.9.1 and later versions. If your version is not supported, create an issue in the rbspy Github repository: https://github.com/rbspy/rbspy/issues.
Configure profiling settings
Before running the profiling session, you can adjust the profiler settings.
Open the Settings dialog Ctrl+Alt+S.
Go to the Build, Execution, Deployment | Ruby Profiler page and specify the following options:
Name - specify the profiler name.
RbSpy executable - specify the path to the rbspy executable.
Profile rate - set how many samples per seconds are recorded.
Profile subprocesses - specify whether to profile subprocesses for the profiled process.
In this dialog, you can use the
button to add additional profiles with specific settings. The
button removes the selected profile.
Run the profiling session
RubyMine provides two main ways to run the profiling session:
Running Ruby/Rails applications with the attached profiler
Attaching the profiler to the already running processes
The procedures below show how to start a profiling session.
Run the Ruby script with the profiler
Right-click the script in the editor or Project view, and select Run 'script name' with 'RbSpy profiler'.
Run the test(s) with the profiler
To profile a specific test, click the
button next to this test and select Run 'test name' with 'RbSpy profiler'.

To profile tests inside a specific file, right-click the script in the editor or Project view, and select Run 'test name' with 'RbSpy profiler'.
To profile tests inside a specific folder, right-click this folder in the Project view, and select Run with 'RbSpy profiler'.
Run the specific configuration with the profiler
RubyMine allows you to run any configuration with the profiler attached. For example, this might be the Ruby, Rails, Rake, or RSpec configuration. To run the required configuration with the profiler, perform the following steps:
Select the required run configuration on the main toolbar.
Click the
button next to the selected configuration and choose Run 'configuration name' with 'RbSpy Profiler'.

Attach the profiler to a running process
To attach the profiler to a process already running on your machine, do the following:
In the main menu, go to Run | Attach Profiler to Process.
Select the required process from the popup and press Enter.

Stop the profiling session
The profiling session will be stopped automatically after stopping an application. To stop the profiling session manually, do the following:
Open the Profiler tool window.
Click the
button.
After the profiling session is finished, you can analyze profiling results.
Analyze profiling results
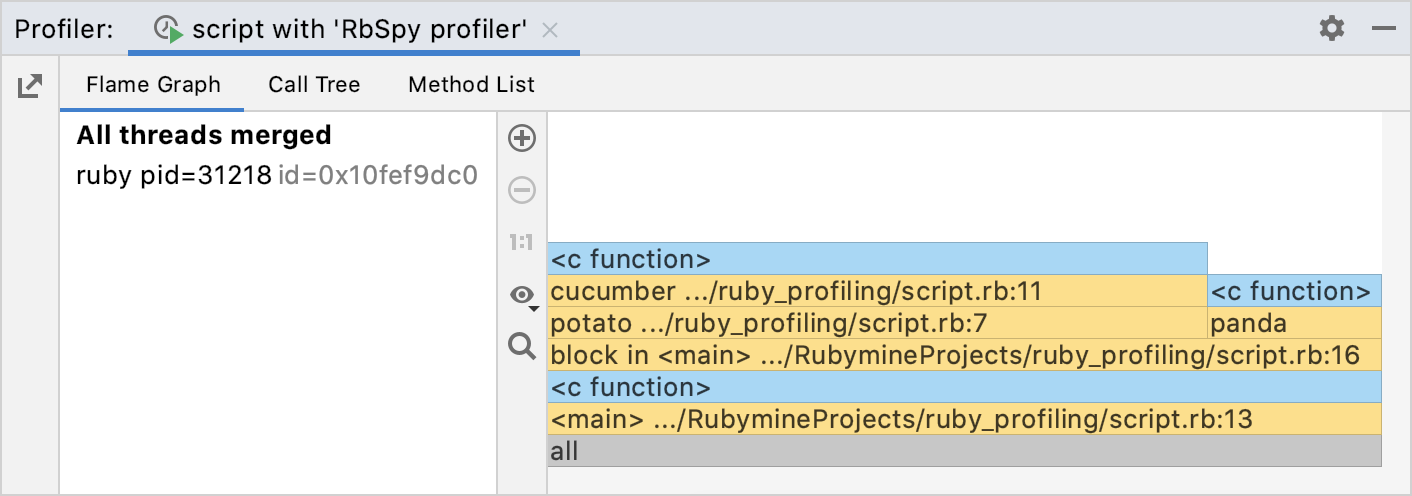
Profiling data is displayed on three tabs - Flame Chart, Call Tree, and Method List. In the left-hand part, you can filter data by the specified thread.

Flame Chart
This tab shows you the state of the call stack at any moment of time. Each frame represents a method/block in the stack (a stack frame). On the Y-axis, there is a stack depth going from bottom up. The X-axis shows the stack sorted from the most time-consuming methods/blocks to the least consuming ones.

RubyMine uses different colors for various types of frames:
Orange for project Ruby methods calls.
Dark orange for Ruby method calls from external gems.
Blue for calls to native C extensions.
When you read the flame chart, focus on the widest frames. You can start from the bottom and move up, following the code flow from parent to child frames. In case you use the icicle chart, read it from top to bottom.
Analyze results
Hover over any item to view the details.
To zoom in/out the chart, use Ctrl + mouse wheel or
/
buttons on the toolbar. You can use the
button to reset to the initial chart width.
Use the mouse or arrow keys to scroll the chart.
Navigate to a specific method by using a double-click. In this case, the chart shows the call stack starting with a parent method colored with grey.
Right-click the item and select Jump to Source to open corresponding code in the editor.
Right-click the item and select Focus on method on Method List to the corresponding method in the Method List tab.
Switch to the icicle chart
An icicle chart is a frame chart upside down. You can read this chart from top to bottom, following the code flow from parent to child frames.
Click the
button.
In the invoked list, enable the Show icicle graph option.
Call Tree
The Call Tree tab shows the program call tree with the percentage of each method in the total profiling time.

To configure and filter the Call Tree view, use the and
buttons.
Method List
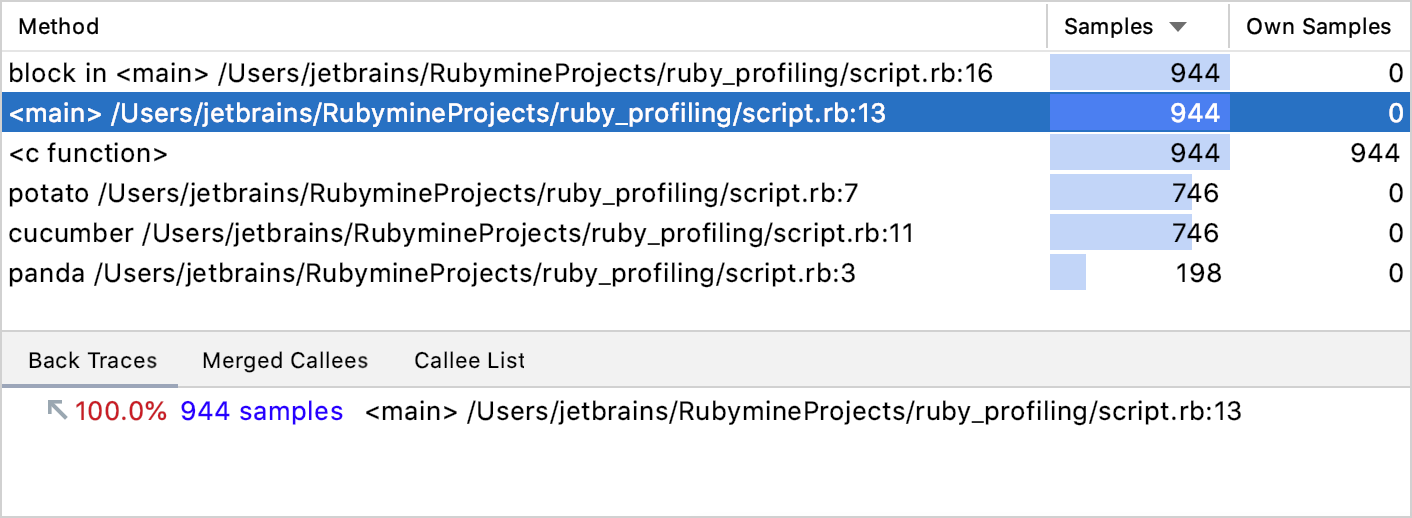
The Method List tab shows the list of methods sorted by the number of samples.

For each method from the list, the profiler provides more information on the nested tabs. The Back Traces tab shows where the selected method has been called. The Merged Callees tab shows call traces that started from the selected method.
Export and import profiling results
Export results
In the main menu, go to View | Tool Windows | Profiler to open the profiler tool window.
In the left-hand toolbar, click
.
In the dialog that opens, name the file and specify a folder in which you want to save it. Click Save.
Import results
Importing results can be useful if you want to analyze profiling results recorded on the production server using rbspy.
To import profiling results from a file, select Run | Import Profiler Results | From File from the main menu.