Performance tuning tips
This article provides an overview of techniques to help improve RubyMine performance when working with large-scale projects.
Increase memory heap
Enable memory indicator
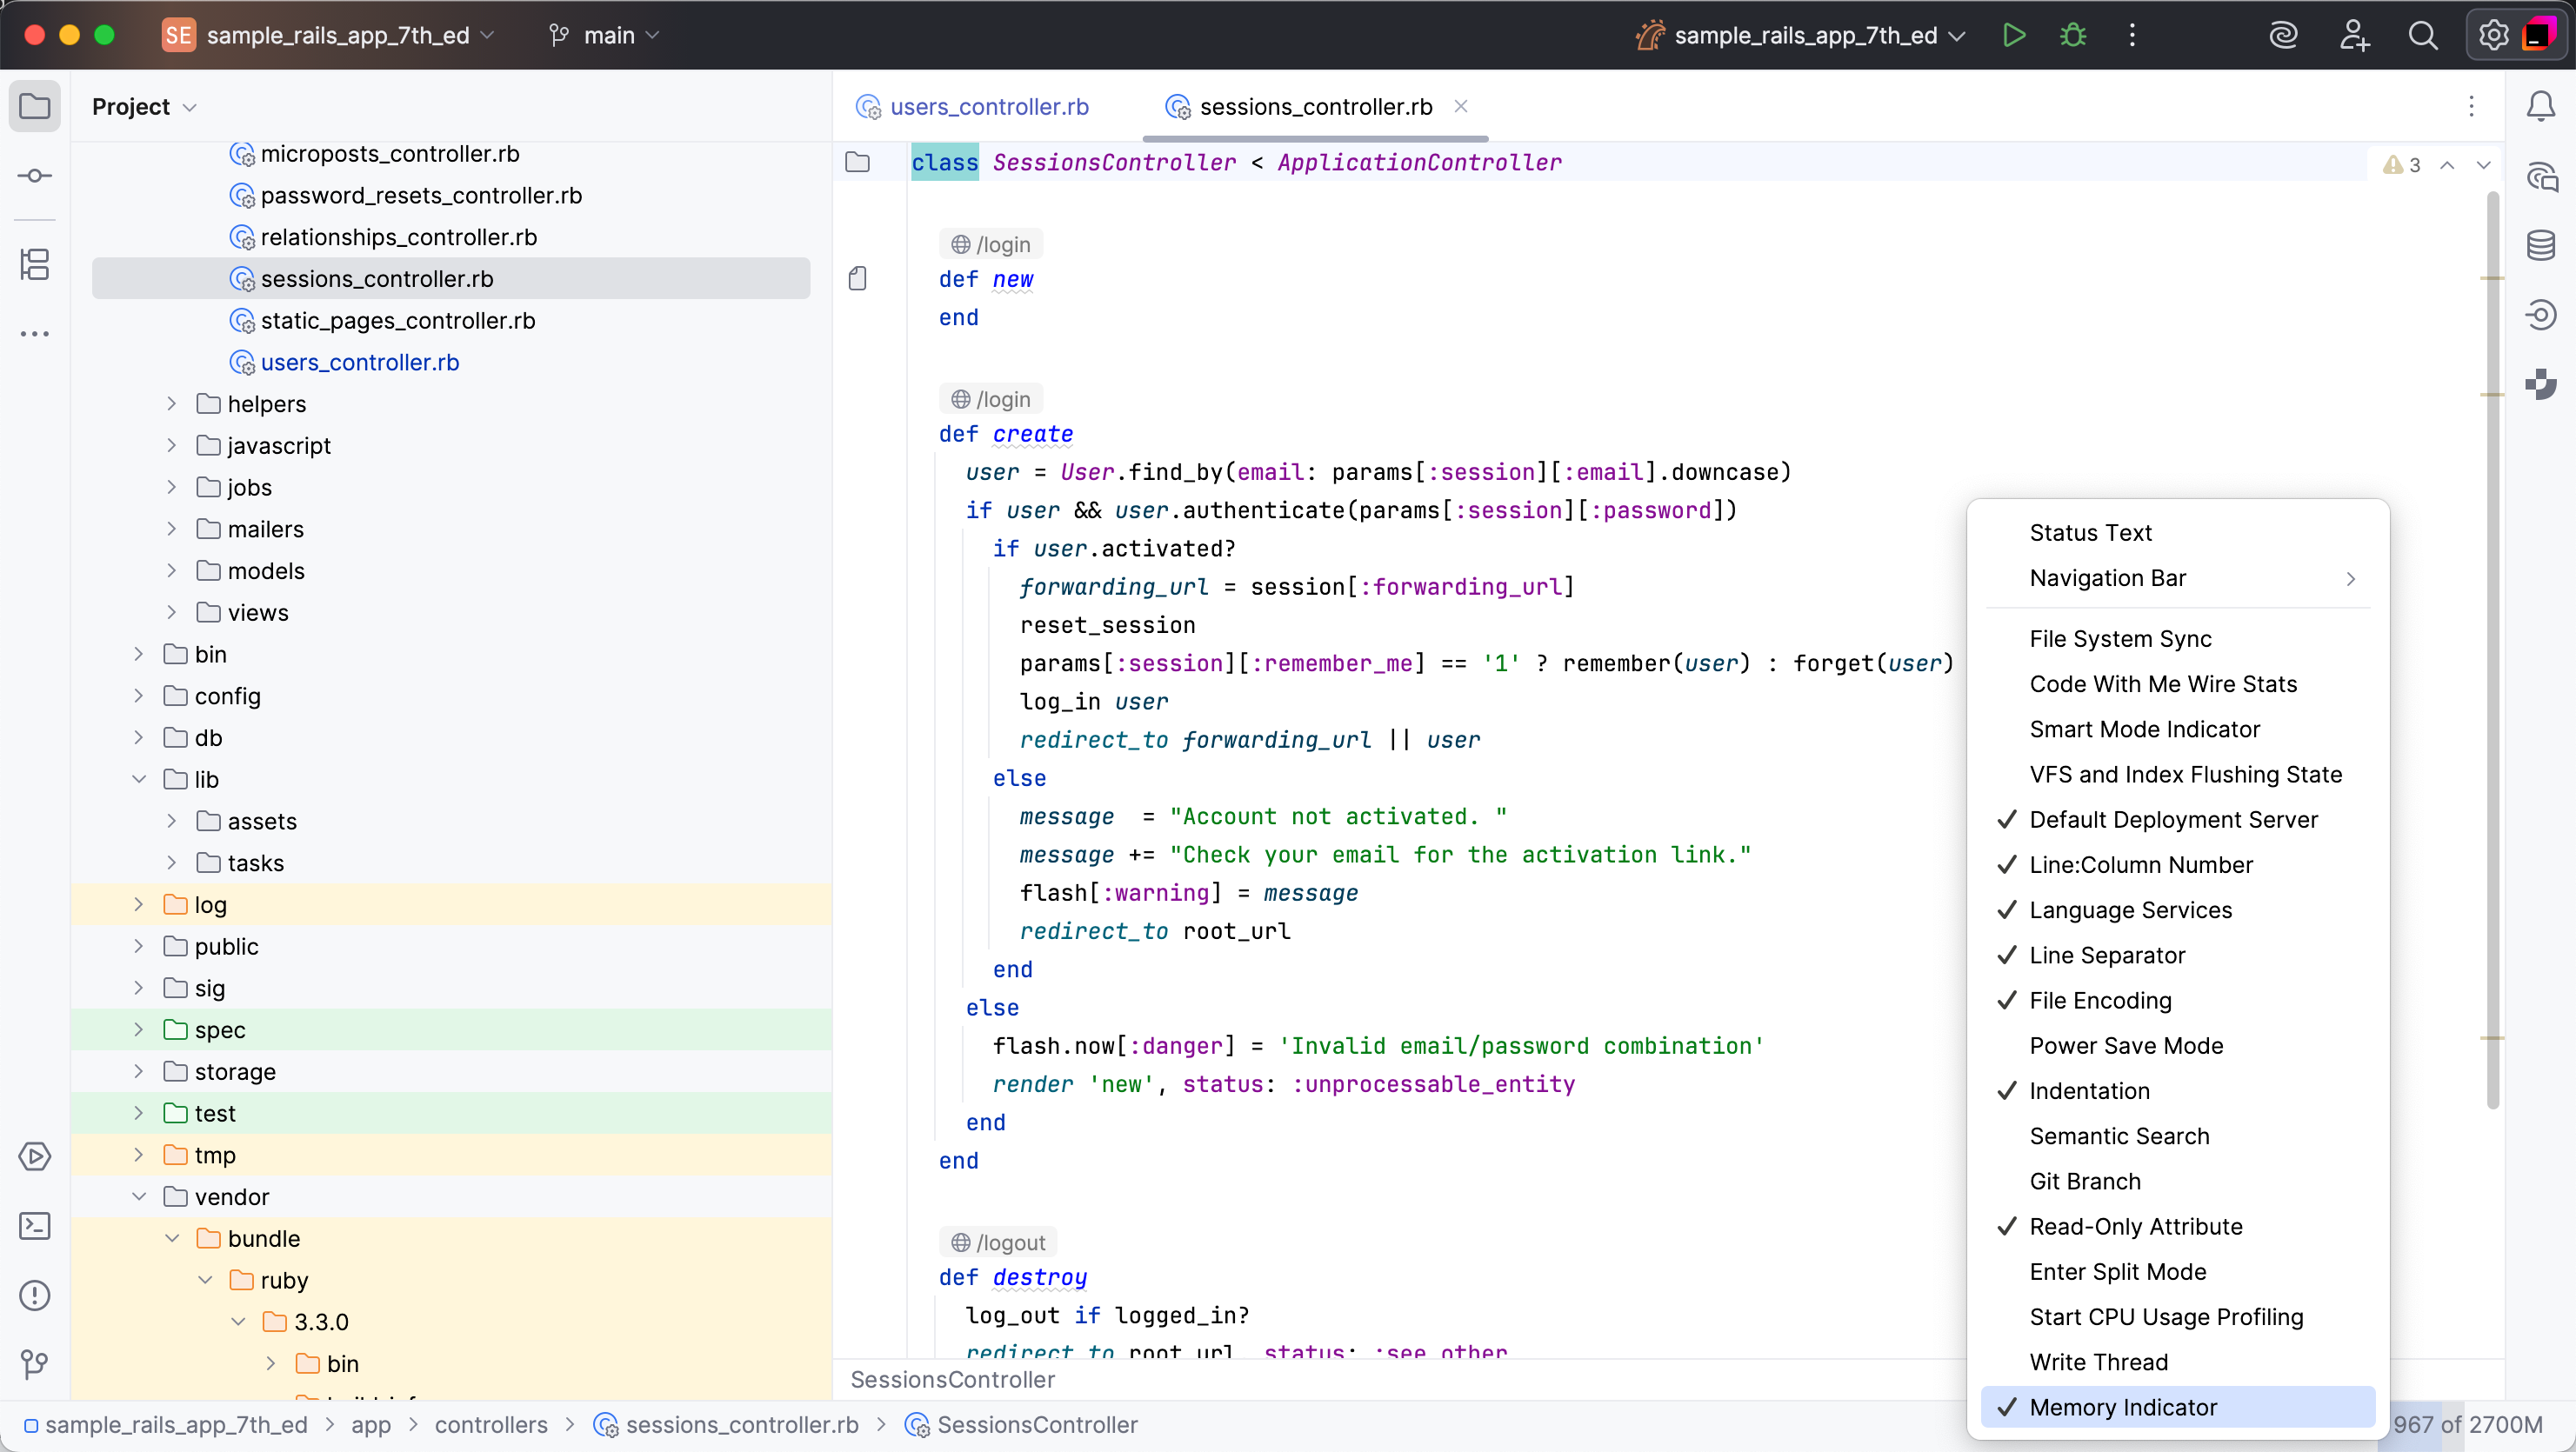
To determine whether performance issues are caused by low heap memory, enable the memory indicator:
Right-click the status bar and select Memory Indicator.
The memory indicator will appear in the bottom-right corner:
Increase memory heap
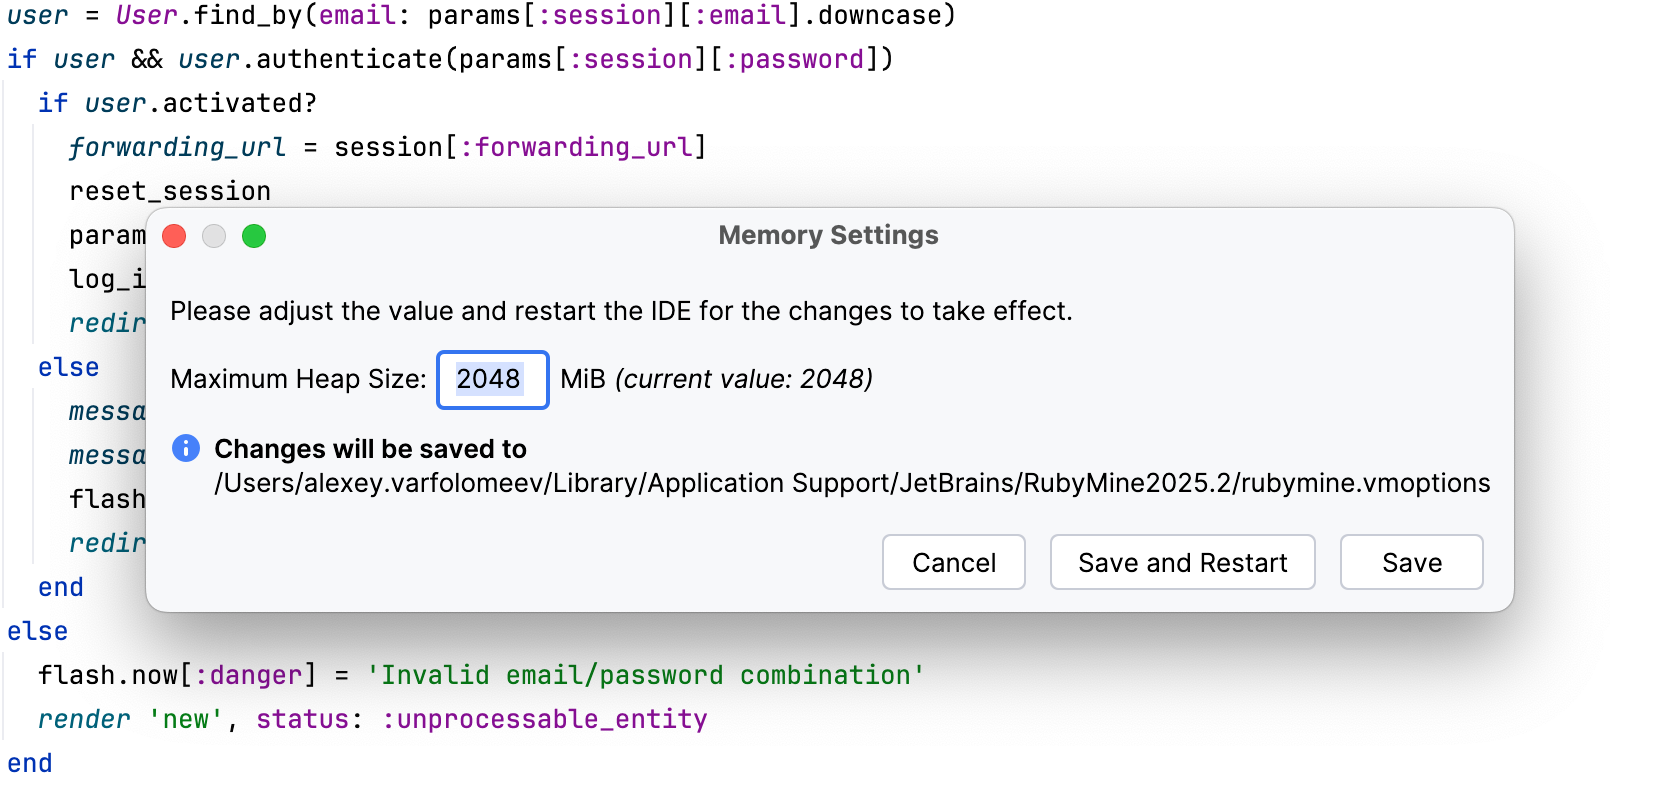
Select from the main menu.
In the dialog that opens, set a higher memory heap value in the Maximum Heap Size field.
Click Save and Restart.
Adjust -Xmx
To increase the memory heap, you can change the -Xmx option, which sets the maximum heap size for the JVM:
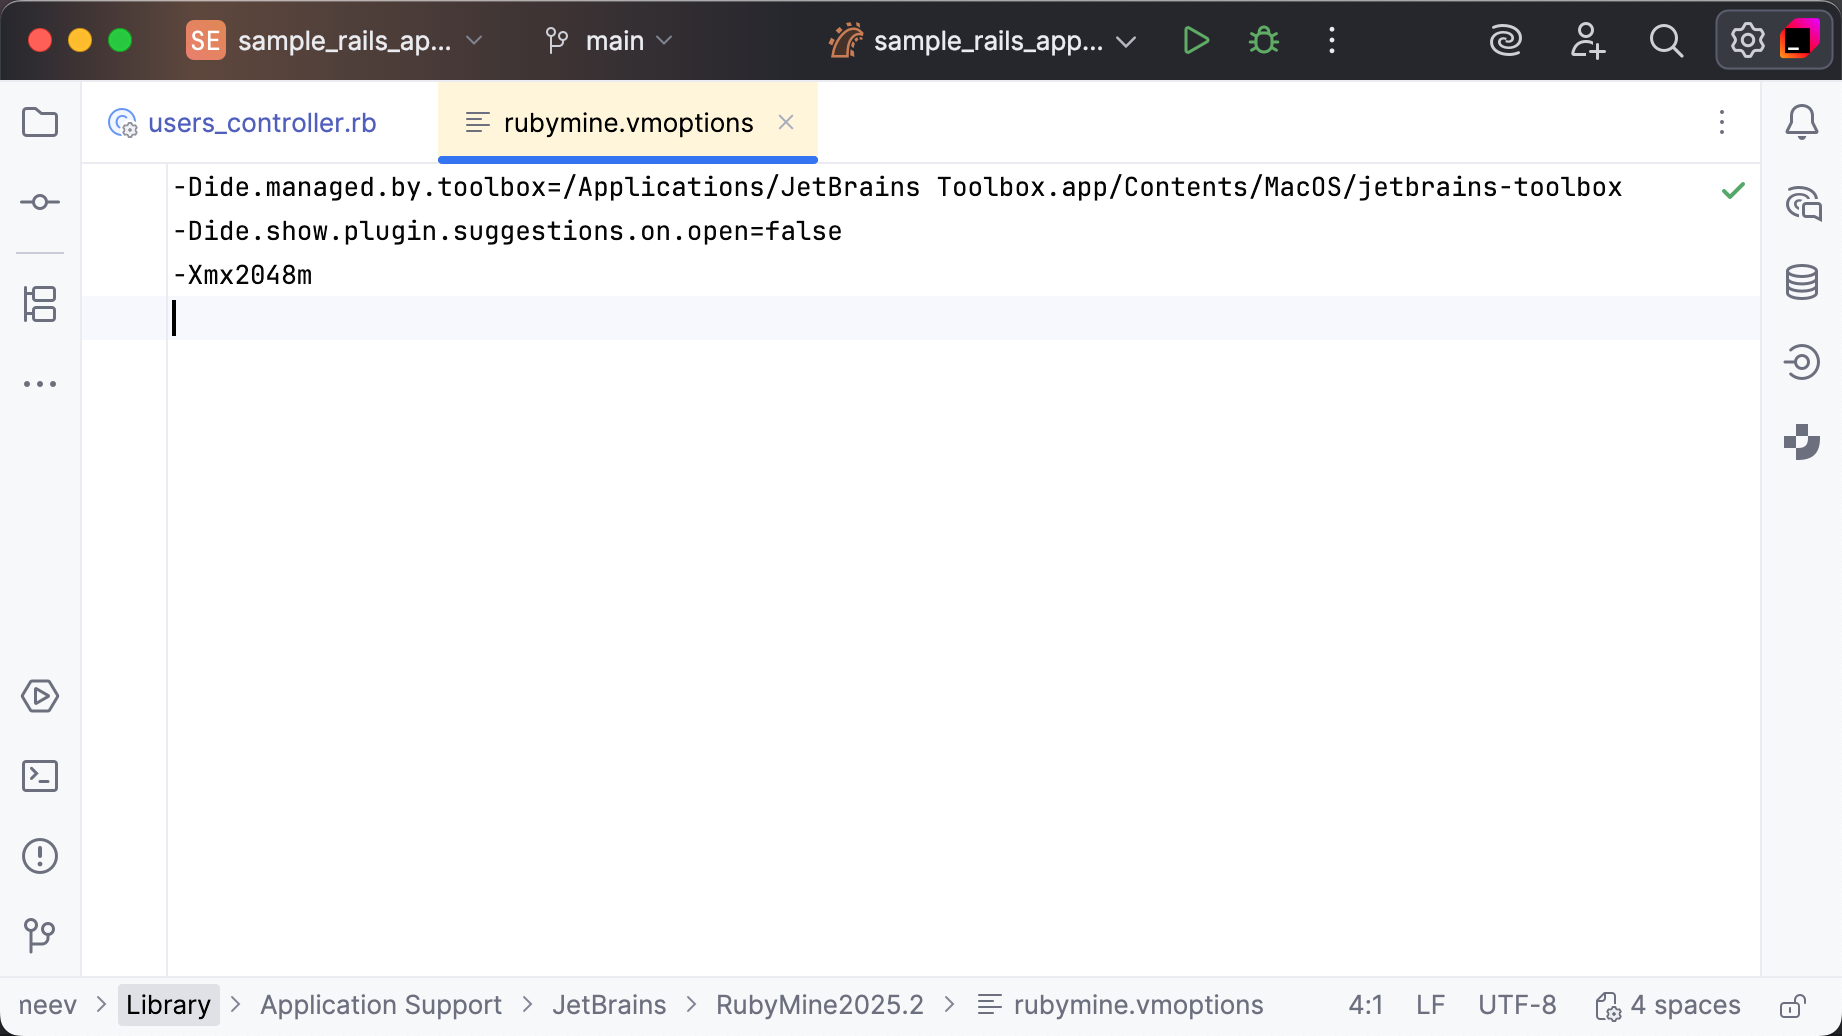
In the main menu, go to . This action creates a copy of the .vmoptions file in the IDE configuration directory and opens it in the editor.
Update the
-Xmxvalue. For example, use-Xmx4096mto allocate 4 GB of memory instead of the default 2 GB.Restart RubyMine to apply the changes.
If the amount of free heap memory drops below 5% of the maximum heap size, a warning will appear. To adjust the -Xmx value, click Configure in the warning box.

Speed up code analysis
Enable Power Save mode
You can enable Power Save Mode or battery efficiency mode using one of the following options:
As an alternative to disabling individual checks or files one by one, try using Power Save Mode. This mode disables all inspections and other resource-intensive processes across the entire IDE.
To enable Power Save Mode, go to .

Right-click the status bar and select Power Save Mode. The
 Power Save Mode icon will appear on the status bar.
Speed up project analysis
Edit files without analyzing (LightEdit)
If you only need to view or make a quick change in a file, use LightEdit mode.
LightEdit mode provides a lightweight editor with syntax highlighting and basic features, which is ideal for quick edits without the overhead of project analysis. Find more details in LightEdit mode.
Identify what slows down project analysis
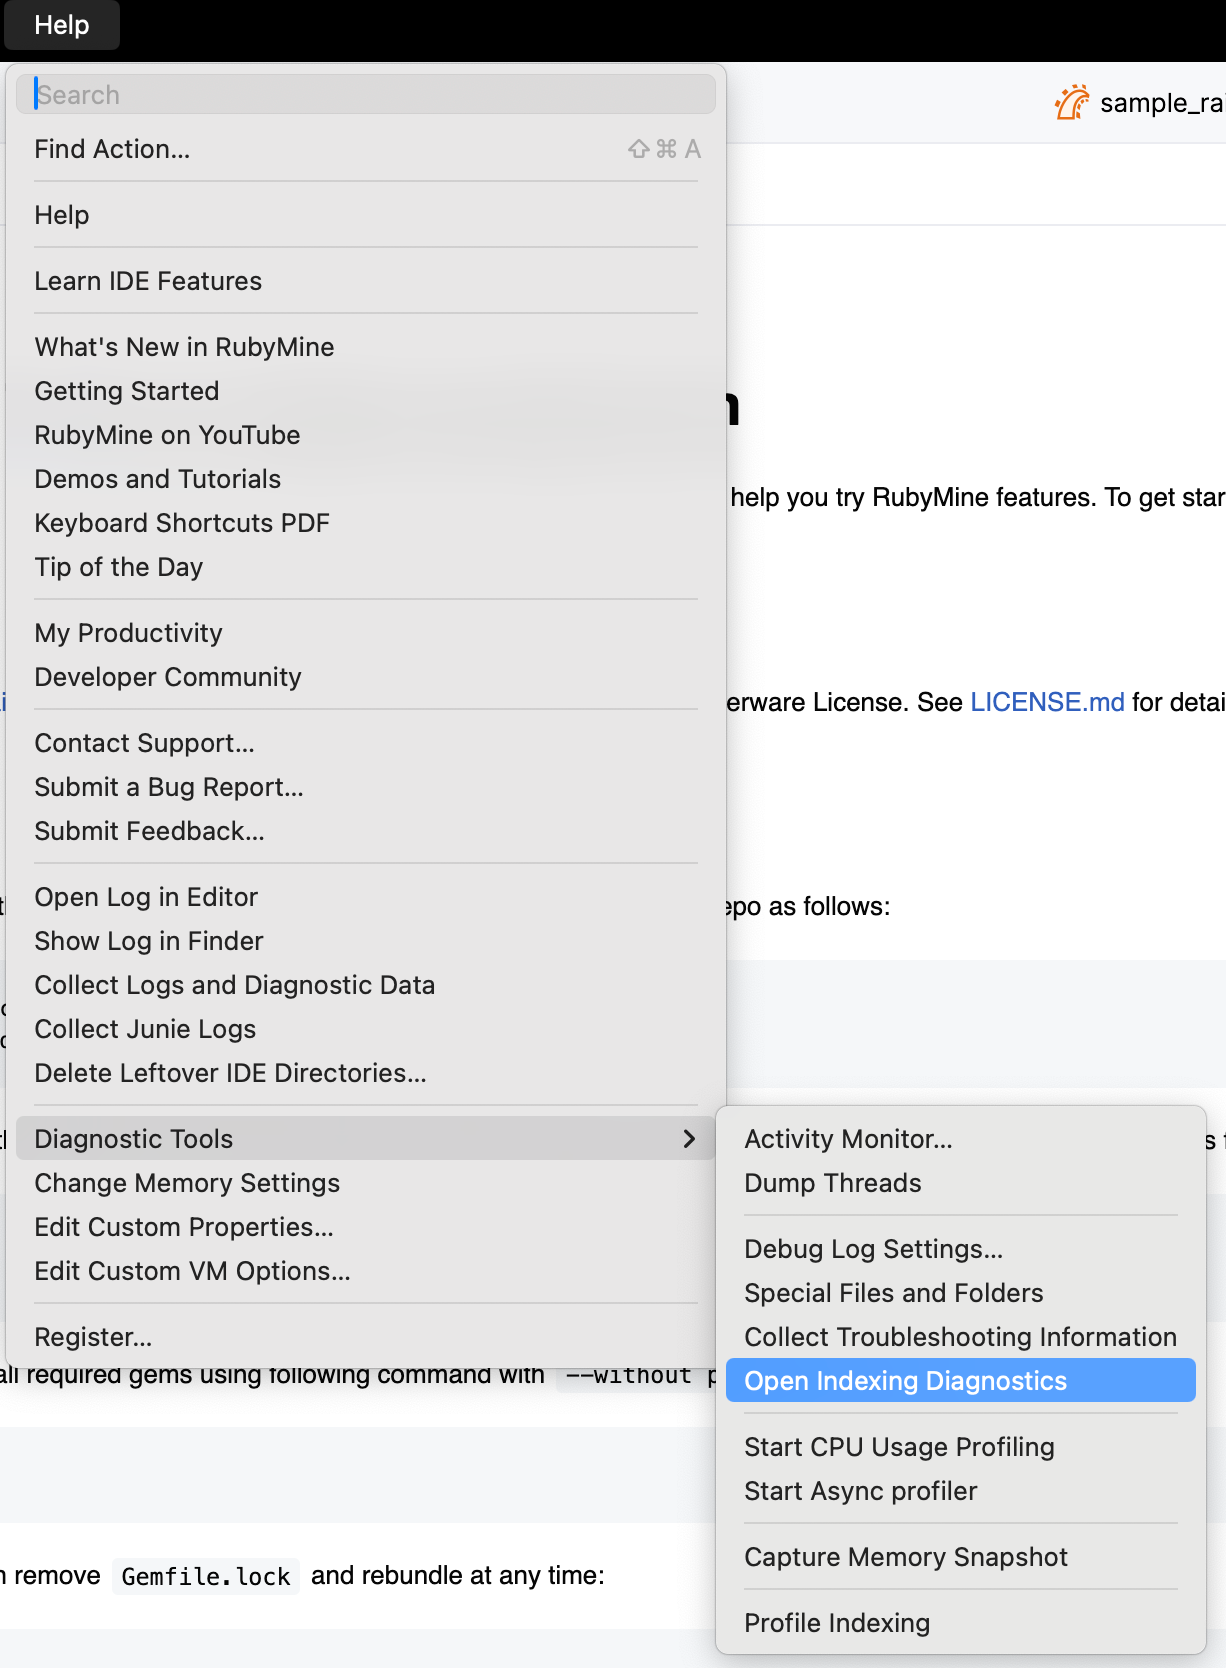
Use the built-in indexing diagnostic tools to see which activities and indexers consume the most resources during project analysis.
Go to to review a detailed report of the project analysis process.
The report includes a list of project analysis activities, their CPU usage, and duration.
After identifying the heaviest contributors, consider narrowing your project scope, excluding generated or vendor directories, and disabling unnecessary language/framework plugins to reduce the project analysis load. Find more details in the procedures below.
Exclude directories and file types
Your project may include folders with binaries, logs, or build artifacts that do not affect RubyMine code insight. Analyzing such folders can also be resource-intensive due to their size or location. In these cases, it is reasonable to exclude the folders manually: right-click the directory in the project tree and select .
Once files are excluded, their symbols are no longer available to RubyMine. The following features will be disabled for excluded files: code completion, auto-import, code generation, Find in Files (except in open files), navigation, and refactoring.
You can also exclude files such as logs or generated data by file type.
Go to and switch to the Ignored Files and Folders tab.
Add a new extension (
) to the list of ignored file types:
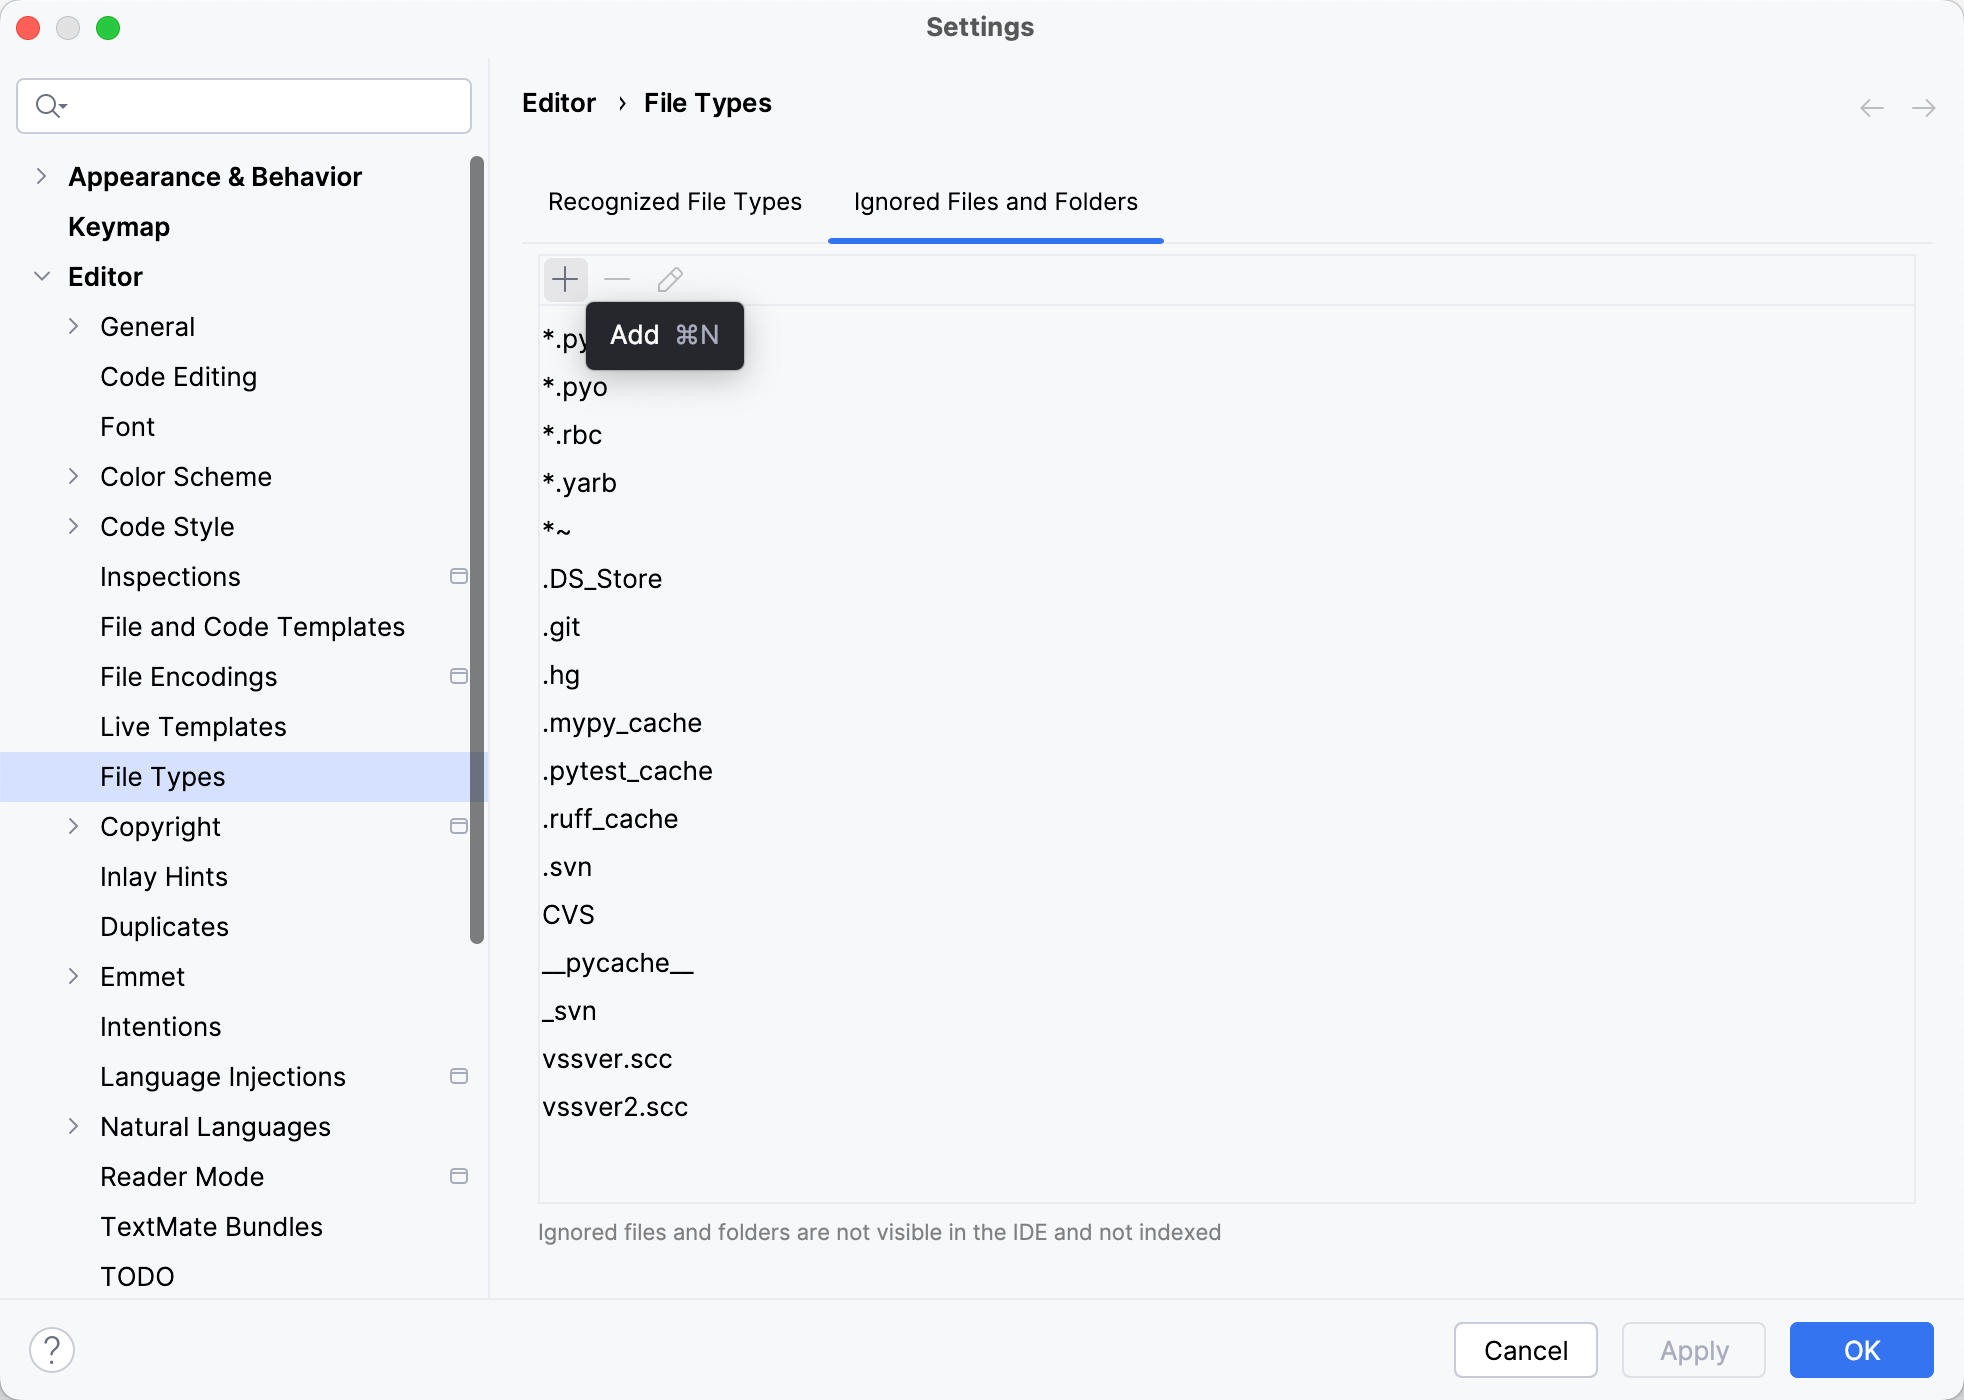
Apply the changes and close the dialog.
Report performance problems
If you experience an IDE freeze or high CPU or memory usage, and the tips listed above do not help, please provide us with the IDE logs, thread dumps, and performance snapshots. For details on how to collect and send this information, refer to this instruction.
Collect RubyMine logs
In the main menu, go to .
You may be asked to confirm the action in the Sensitive Data dialog by clicking Show in Finder.
