Performance Monitor
The Performance Monitor build feature allows you to get the statistics on the CPU, disk and memory usage during a build run on a build agent. The Performance Monitor supports Windows, Linux, Solaris and MacOS X operating systems. Note that the performance monitor reports the load of the whole operating system. It will not report proper results if you have more than one agent running on the same host, or an agent and a server installed on the same machine.
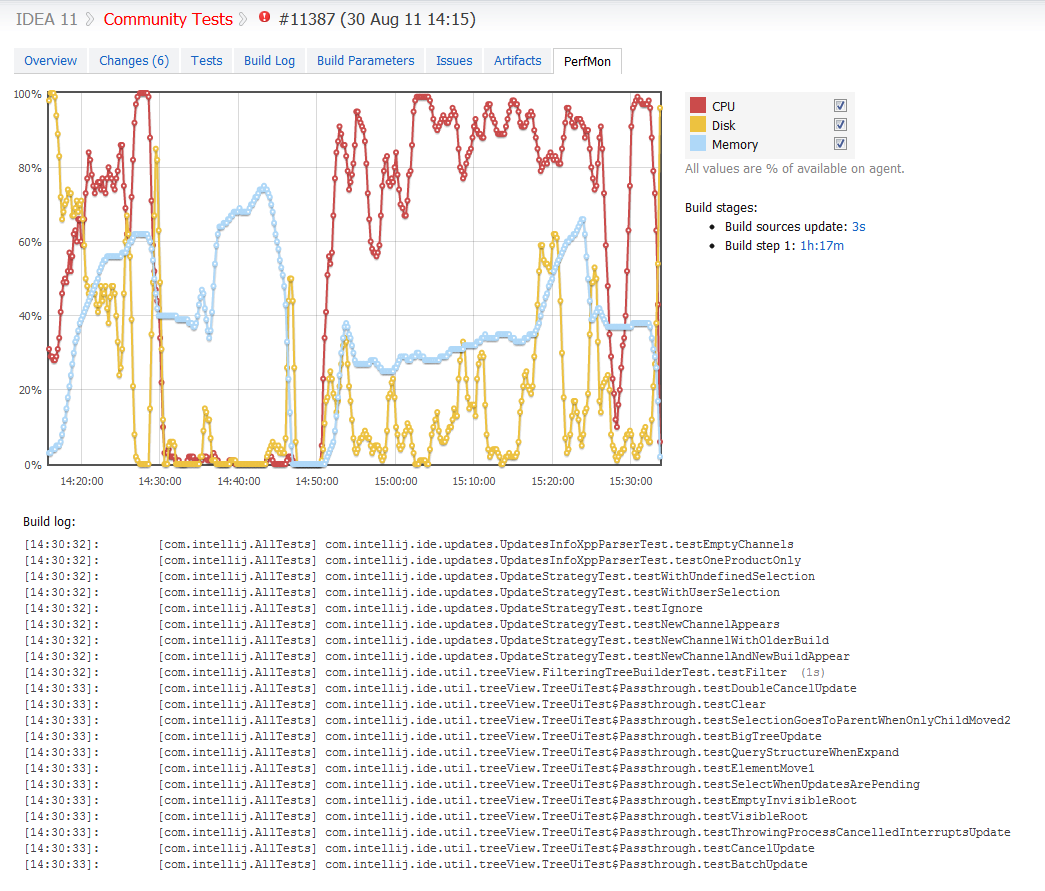
When enabled, each build has an additional tab called PerfMon on the build results page, where this statistics is presented as a graph. The CPU usage shows the average CPU load during the build, the Disk and Memory usage values are relative to the total disk and memory available on the agent machine. Clicking on a point in the graph displays the corresponding value (CPU in screenshot below) as well as the build log with the highlighted fragment for the selected time.
For example, from the picture below it is clear that at some point the CPU and Disk usage is very low. This lasts for about 20 minutes. It seems that the tests executing at this time need some investigation, probably, most of the time they are blocked on some lock or wait for some event:
