View Build Results
TeamCity offers a comprehensive overview of build results:
Detailed build log
Test results and problems
Pipeline statuses
Artifacts
Changes in sources
and many more, including custom graphs
In this article, we give a quick overview of how to explore build results in TeamCity. Note that the examples showcase the Sakura UI, but if you prefer the classic UI, you can find many of these features in it as well. To switch between the UIs, use the toggle in the upper right corner of the screen: ![]() for the classic UI and
for the classic UI and ![]() for the Sakura UI.
for the Sakura UI.
Preview Projects and Build Configurations
TeamCity has two main modes: the Home mode is for viewing results and running builds, and the Edit mode is for configuring settings. The switch between them is located in the upper right corner of the screen. Note that it's only available if you have rights to edit projects' settings.
Both Project Home and Build Configuration Home allow you to monitor builds and perform all the basic actions.
Build Configuration Home shows statuses of the recent builds, per branch or all combined. To preview a build without opening its results, you can just expand it in the list:

Project Home gives a more general overview of all the project's subprojects and build configurations. The Builds mode aggregates Build Configuration Home views of the nested configurations. The Trends mode displays configurations as interactive graphs:

Explore Build Results
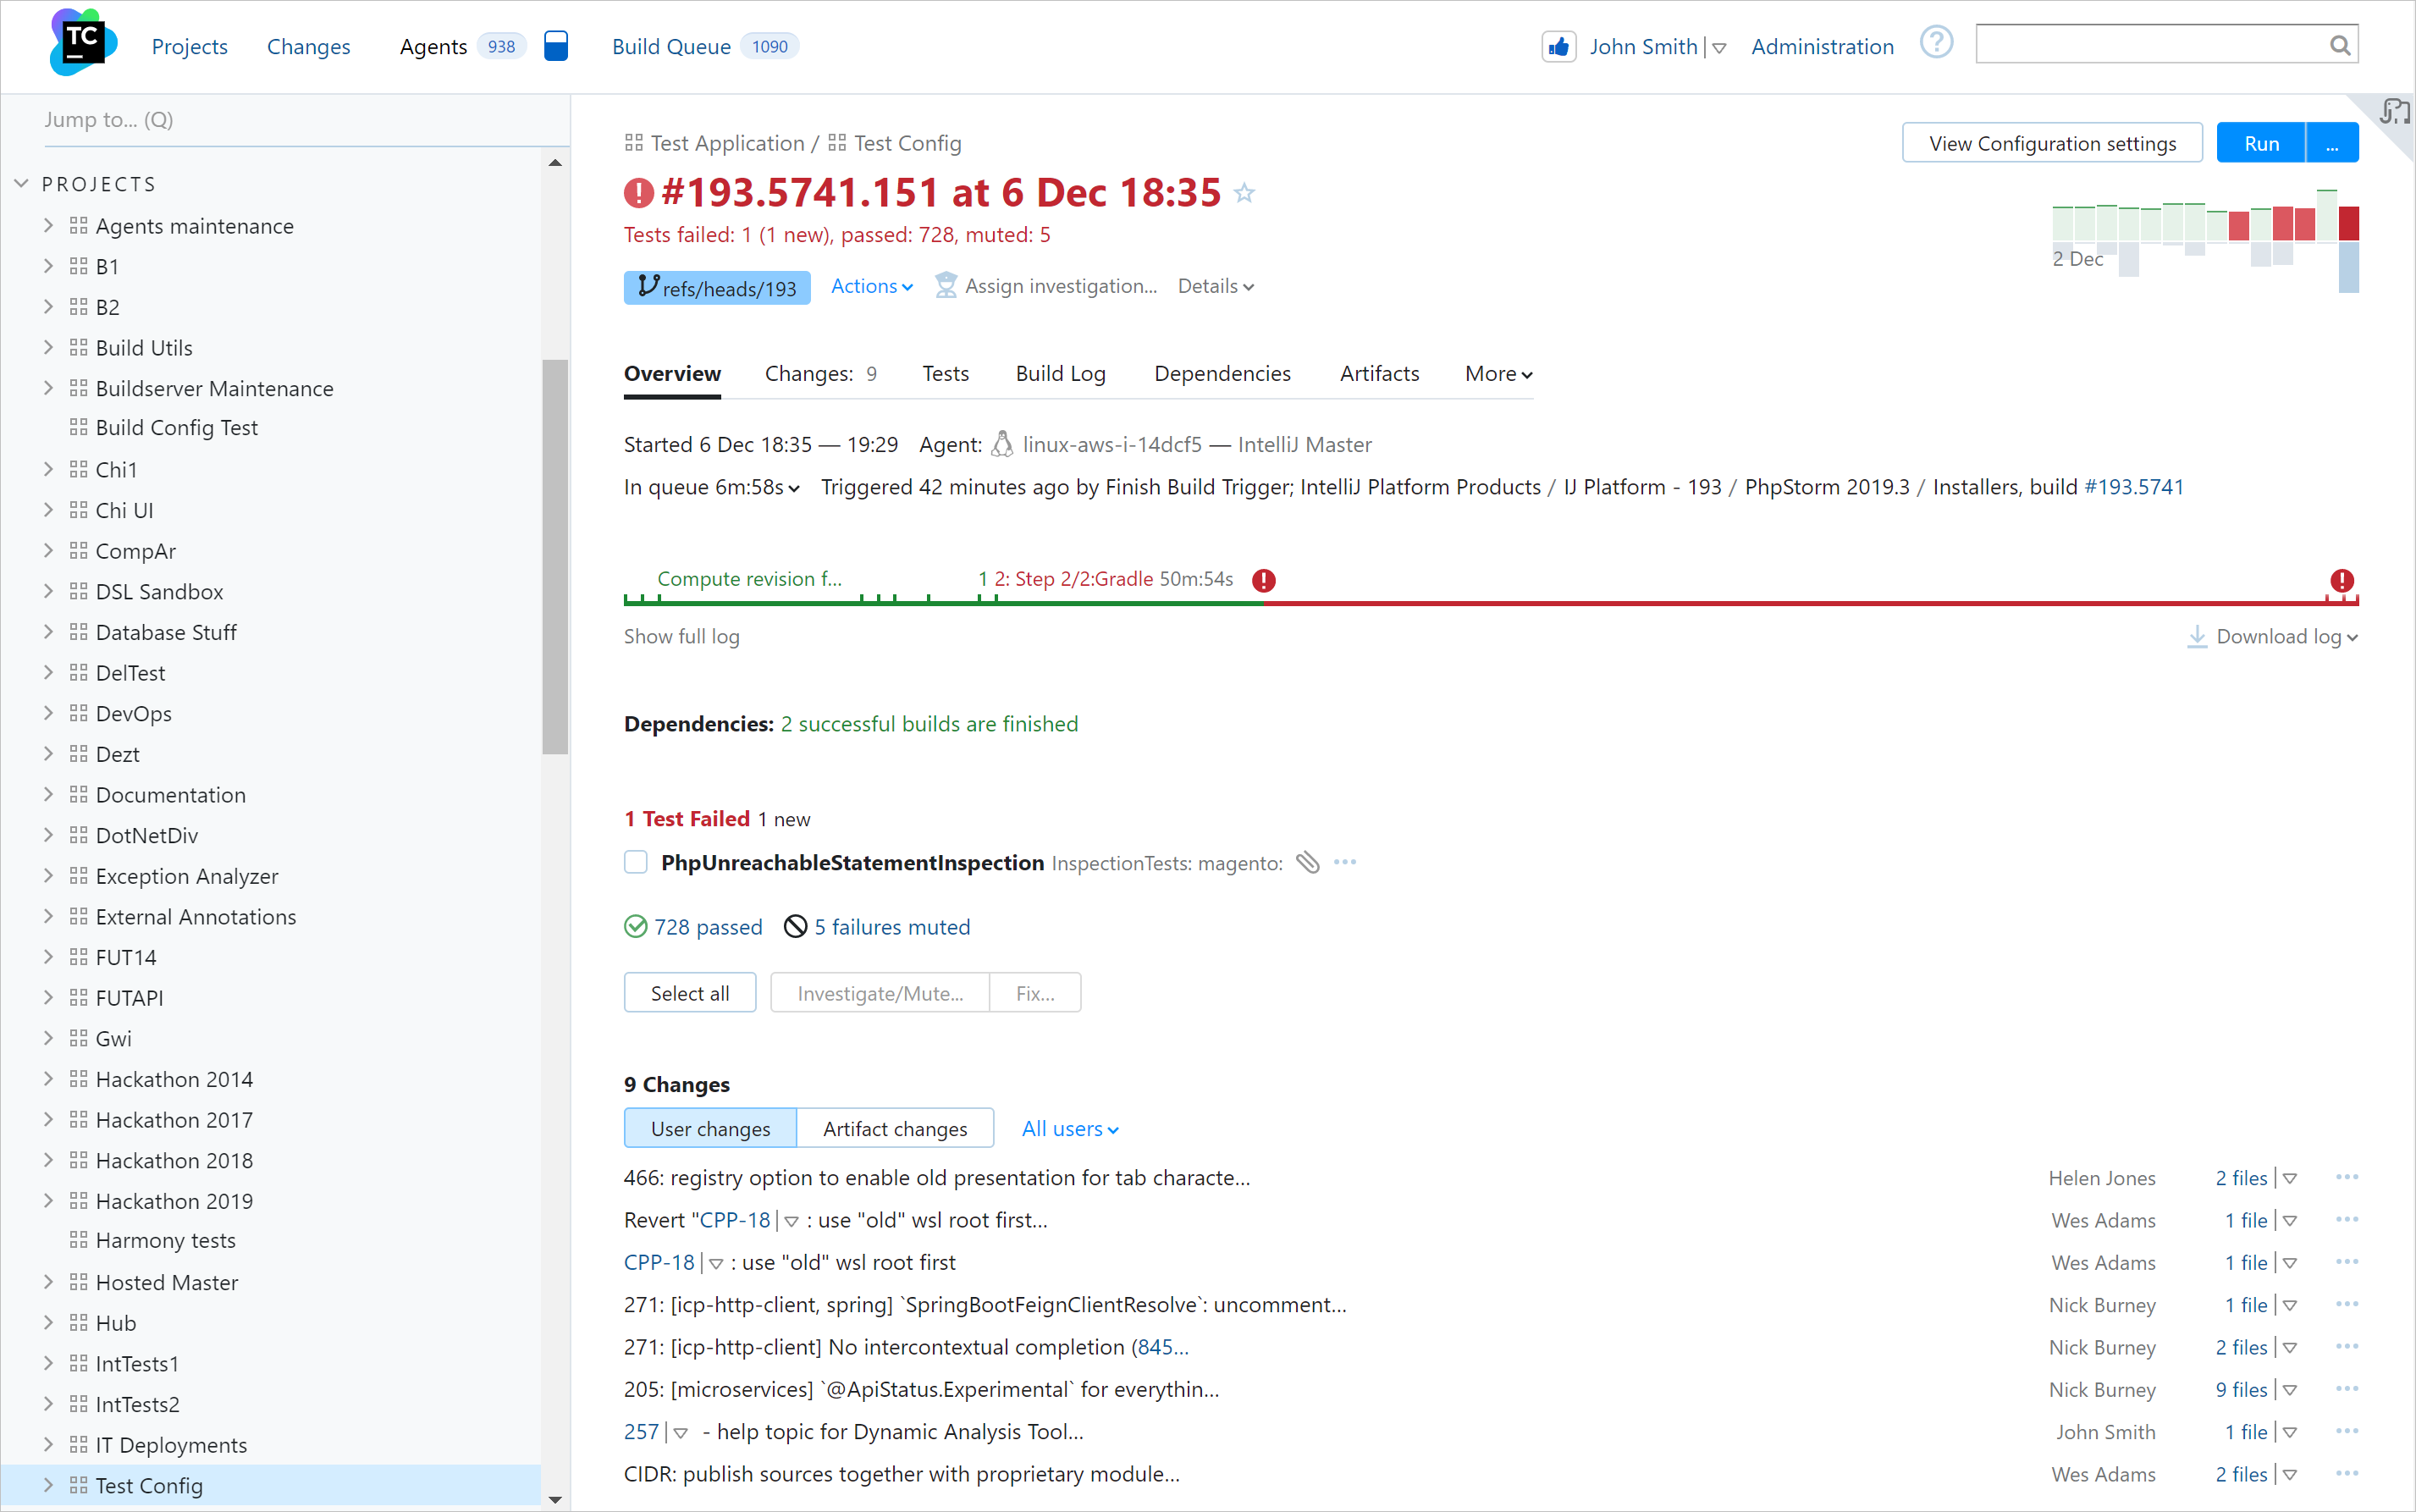
If you click a build in the list, its Build Results page will open.

The heading part of this page shows:
General information like number, date, and statistics.
Branch selector.
The Actions menu from where you can label, pin, compare builds, and perform other operations.
The Run button.
A switch to the settings menu.
A widget with the recent builds' statuses. Hover over any of them to see its details.
Below the heading, there are multiple tabs you can explore for more details. The most important ones are:
Overview: a summary of all the results. Contains an interactive build timeline and collapsible blocks with summary of other tabs.
Changes: revisions and commits that got to this build.
Tests: all the information on tests. Here, you can explore the test history, download test results in CSV, as well as mute tests, assign their investigator, or mark them as fixed.
TeamCity puts a lot of effort into making the test preview as informative and rich as possible. Moreover, you can view test results on-the-fly, while the build is still running.Dependencies: a visualized build chain, or pipeline, the current build belongs to. Three modes with different levels of detail are available.
Artifacts: browse and download the build artifacts.
Parameters: see what parameters' values were passed into this build.
The set of displayed tabs depends on the build's specifics (see more information on the default tabs). Some of them are displayed only if a certain feature is enabled. For example, if you add the Docker Registry Connections feature to a build, the Docker Info tab will appear in its results.
You can also add a tab with custom charts based on XML.
View Build Log
A detailed and structured build log is one of the strongest points of TeamCity.
You can access a build log both from the Overview and Build Log tabs. If there are any problems or failed tests in the build, you can quickly view the relevant parts of the log right in the Overview. You can also click on any place on the build timeline to open the related part of the log.

The Build Log tab shows a structured log with highlighted warnings and errors. Its main blocks are by default collapsed, so the log is easier to navigate. You can explore the log manually, search and filter messages by their text and type, or download the full log.
If you want to customize how TeamCity produces the log output, use special service messages.
Extras
Apart from viewing the Build Results page directly, you can monitor the build statuses by:
Configuring notifications to a messenger, email, or in a browser.
Integrating TeamCity with a third-party service. For example, if you use Jira Cloud, you can display the main build results right in the tasks related to each build (learn how).
Publishing build statuses to your VCS repositories via Commit Status Publisher.
Using our plugins for IDEs, such as IntelliJ Platform Plugin.