Working with Code Inspections
With TeamCity's server-side code inspection the whole project code base is tested as often as you need. Your computer is kept free, so no real development time is lost. All of your changes to the source code are integrated into the code base and checked to make sure that they conform to coding standards, guidelines, etc.
TeamCity plugin enables you to:
Examine results of server-side code inspections without leaving the IDE either in the editor or in the Inspection tool window.
Apply quick fixes (suggested solutions to the problems discovered during the inspection).
To inspect your code remotely on the server-side, a build configuration with the Inspection build runner pointed to the project file should be created. After TeamCity creates a build, you can review the issues found in the IDE, and the server-side inspection report is loaded into the editor. The coding violations are highlighted in the gutter; you can customize the highlight color in the Colors and Fonts dialog.
Please note that the view of the inspection results downloaded from the server is the same as the one of run locally.
This section describes how to:
To display code inspection results in the editor
On the main menu, choose .
In the Available Inspection Builds dialog box that opens, click the desired project name.
To view code inspection results in the Inspection tool window
On the main menu, choose .
-
In the Choose Project to Browse Inspections dialog box that opens, click the desired project name.
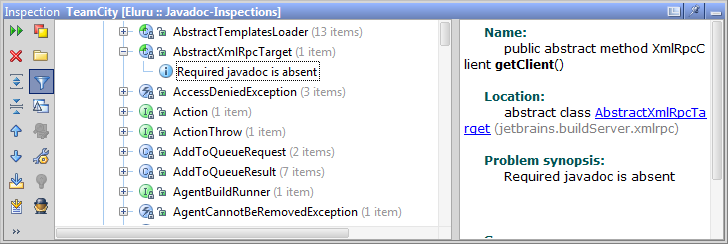
The Inspection tool window similar to the following screen opens:

For detailed information on the Inspection tool window, refer to IntelliJ IDEA Web Help.
To navigate from the report in the Inspection tool window to the problem location in the source code
In the Inspection tool window, select the desired node.
On the context menu of the selection, choose , or use the F4 keyboard shortcut.
To apply quick fixes to discovered problems
Navigate to the issue found in the editor and click the light bulb or press Alt Enter. The IDE pops up a list of suggestions for the particular issue.

To configure code inspection highlighting
Open the Color and Fonts dialog ().
Select the desired color scheme.
In the General tab, select Problem from server, and configure the style and color of highlighting.